New Zealand's inflation data for the fourth quarter was released overnight, showing the headline CPI remained steady at 2.2%, slightly higher than the expected 2.1%. However, the non-tradable inflation index, which is closely watched, dropped more than expected to 4.5%, its lowest level since late 2021 and below the Reserve Bank of New Zealand's (RBNZ) previous forecast. This has increased the chances of a 0.50% interest rate cut by the RBNZ at their February 19 meeting, with further cuts expected later this year. In the short term, the NZDUSD pair may find some support above 0.570, helped by reduced concerns over US tariffs on China and technical factors favoring the NZD after recent heavy selling. However, the RBNZ's focus on supporting economic growth will unlikely provide much strength to the currency in the long run.
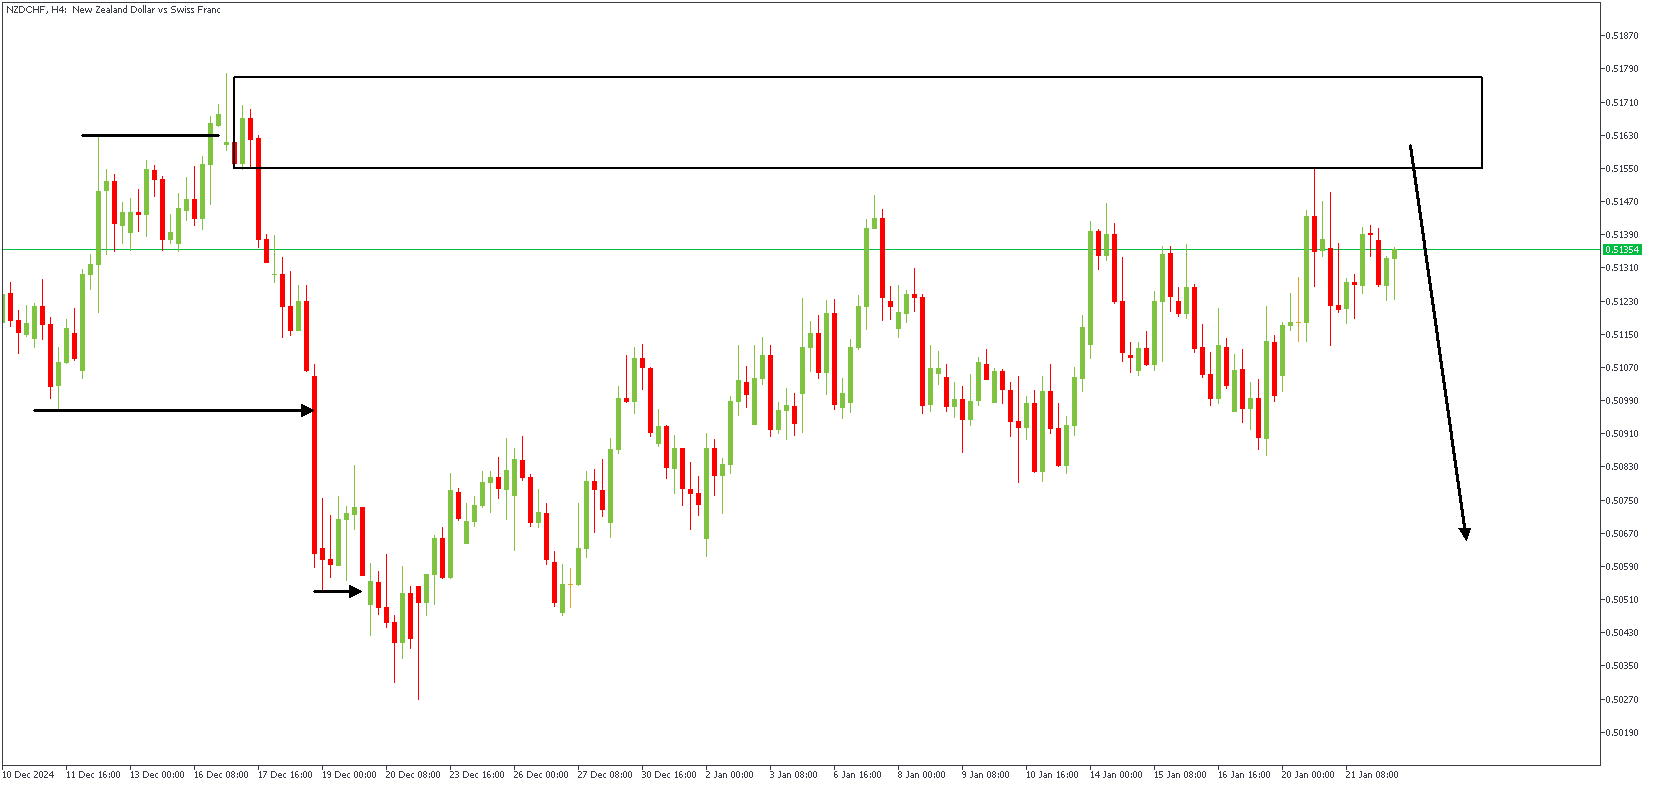
NZDCHF – H4 Timeframe

By now, I've written so many references to the SBR (Sweep-break-Retest) pattern that any avid reader of my work must be familiar with the pattern already. The SBR pattern shown on the 4-hour timeframe chart of NZDCHF begins with the sweep above the previous high, followed by the immediate break below the previous low. Based on this, the supply zone at the origin of the bearish impulse serves as the supply zone of interest. In addition, the Fibonacci retracement tool places the supply zone near the 88% level, further increasing the likelihood of a reaction from the highlighted supply area.
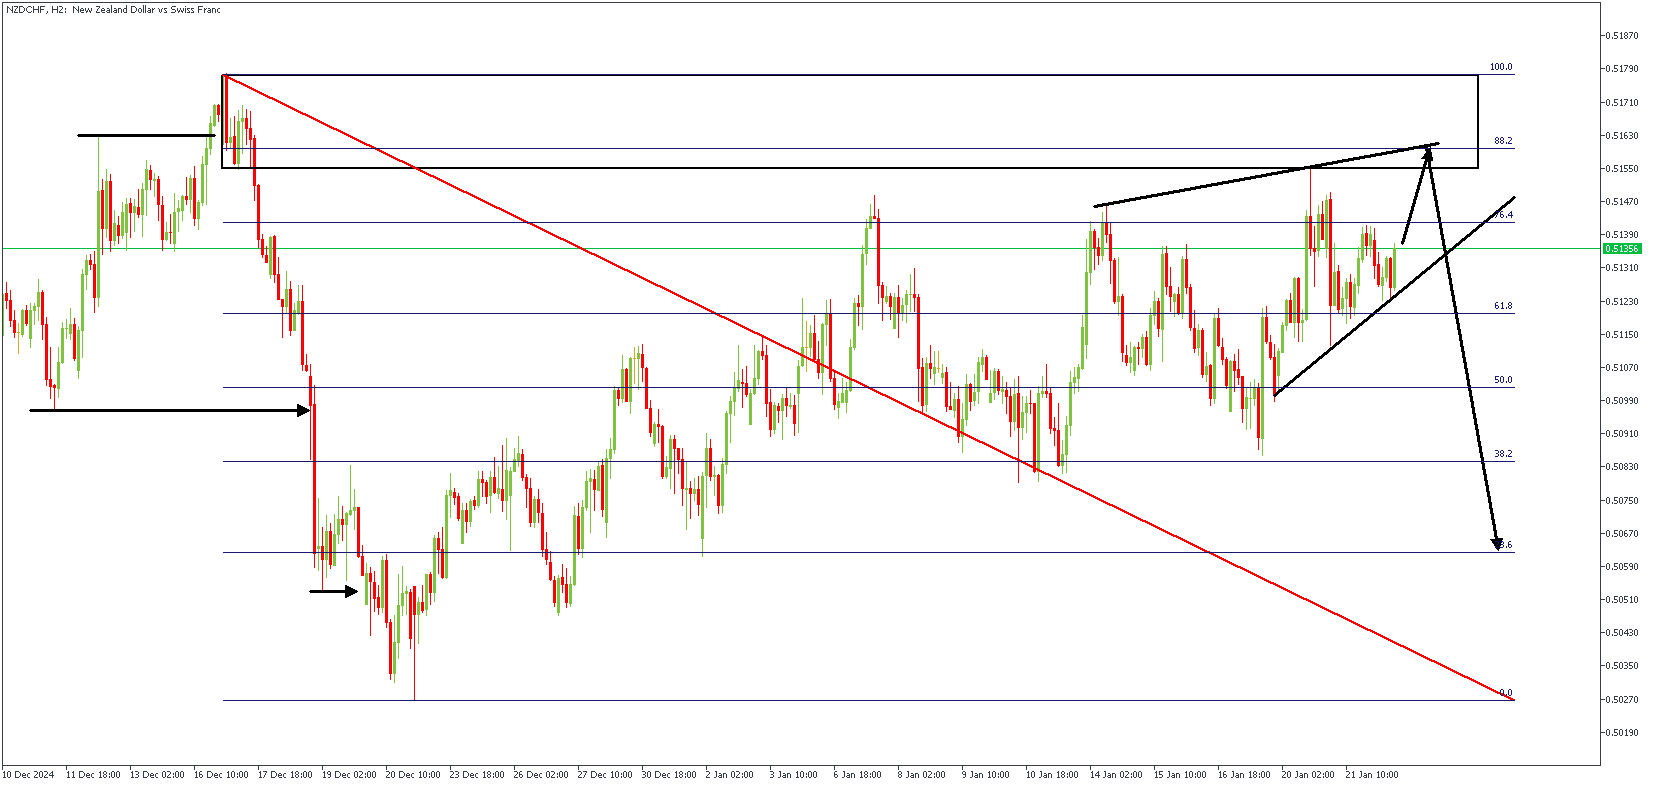
NZDCHF – H2 Timeframe

The two-hour timeframe chart of NZDCHF shows price consolidating within the wedge pattern presented near the 88% Fibonacci retracement level and the supply zone of the SBR pattern. The price should take a bearish turn from the said region on this ground.
Analyst's Expectations:
Direction: Bearish
Target: 0.50626
Invalidation: 0.51837
CONCLUSION
You can access more trade ideas and prompt market updates on the telegram channel.


