Short term
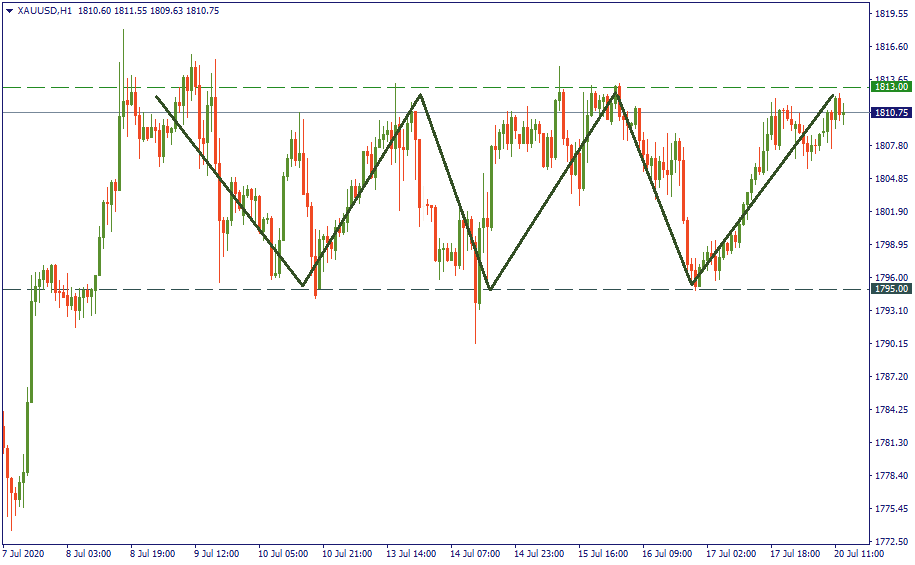
Since July 8, the gold price has been in a clear sideways channel best visible at the hourly chart. $1 813 serves as the channels’ resistance, and $1 795 - as the support. In broader terms, it will be enough to specify that gold price fluctuates between “roughly below $1 800” and “slightly above $1 810”.
Currently, it is at the upper border of the channel and gives initial signs of a bearish reversal. Nevertheless, we don’t have enough signs so far to be more confident in this reversal, therefore more time is required to verify this assumption. That’s why the suggested strategy is to wait and watch closely how the price behaves in the coming hours/tomorrow around the resistance of $1 813. In any case, keep in mind – this sideways movement will not take long to convert into another bullish advance.

Long term
Last week, we noted how tangled the world economic recovery is now, and how that pushes the price of gold higher. Today, even with the European leaders discussing the financial aid measures and brings more hopes to the market, we still have the strategic layout unchanged.
Fundamentally, we have a very bumpy global economic recovery, clouded by resurging virus infections, still on fire in the US. In addition to that, international relations do not make it any better: US-China, US-EU, Australia-China, UK-EU – all of these are importing more tension into the market, and gold rises.
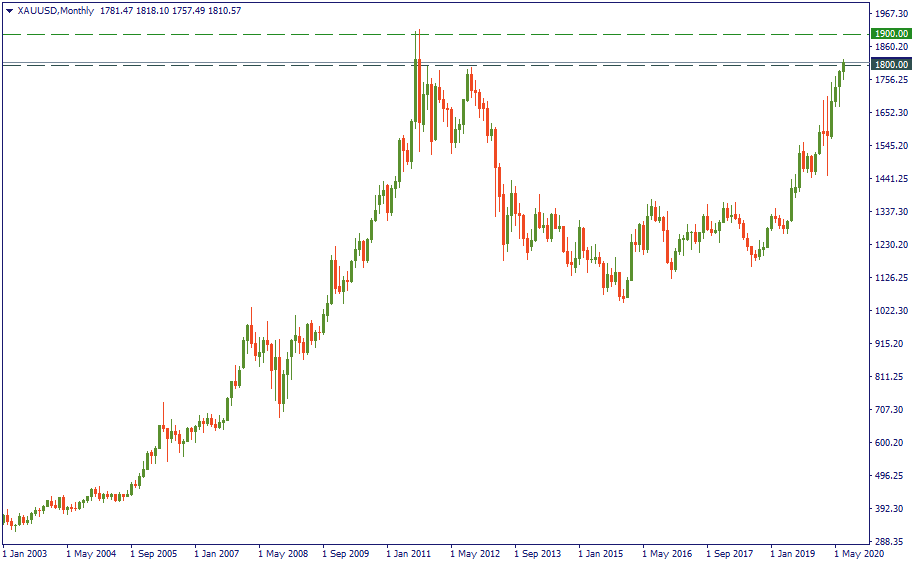
It took approximately one month for the gold price to leave $1 700 below and come to $1 800. With the cloudy economic future of the world, we should see $1 900 by the end of August. That means, in 4-5 weeks we will behold the nine-year-old all-time high beaten and surpassed.

LOG IN


