GBPUSD, H2
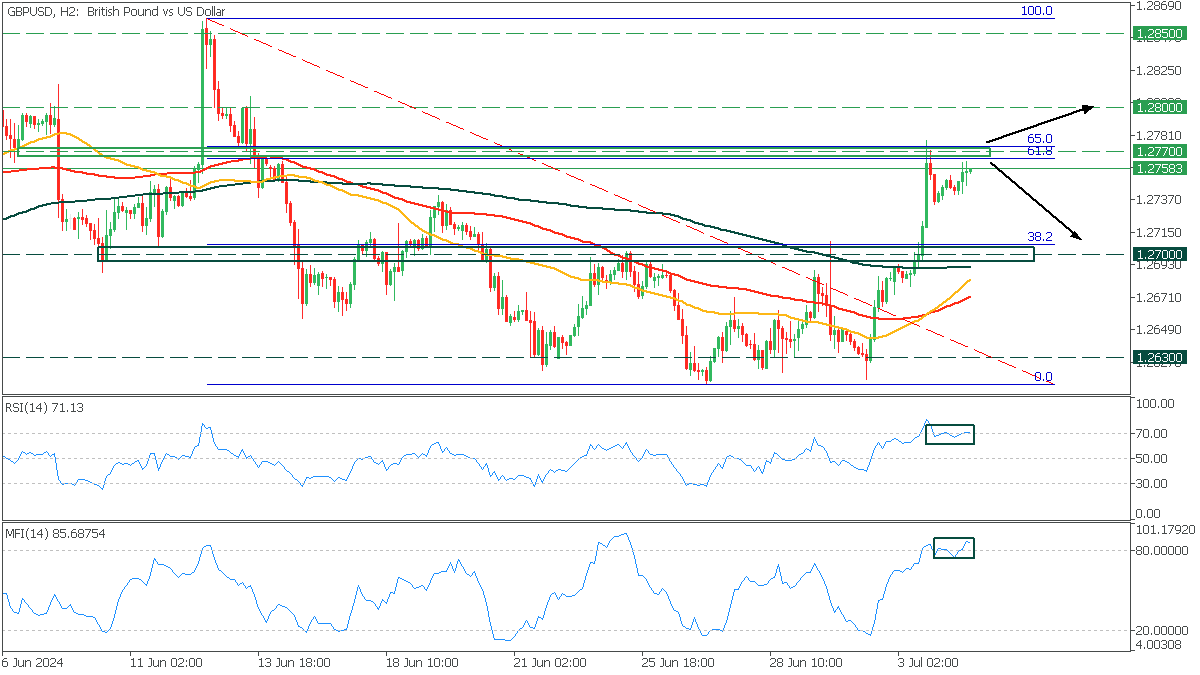
On the H2 chart, GBPUSD tests the crucial 1.2770 resistance level, aligned with the golden Fibonacci ratio. The MFI and RSI oscillators indicate overbought conditions for the asset, potentially signaling a decline.
- If the price rebounds from this resistance, it may fall to the 1.2700 level;
- However, if it breaches above golden Fibonacci ratio, it could propel the asset to 1.2800.