AUDUSD, Daily
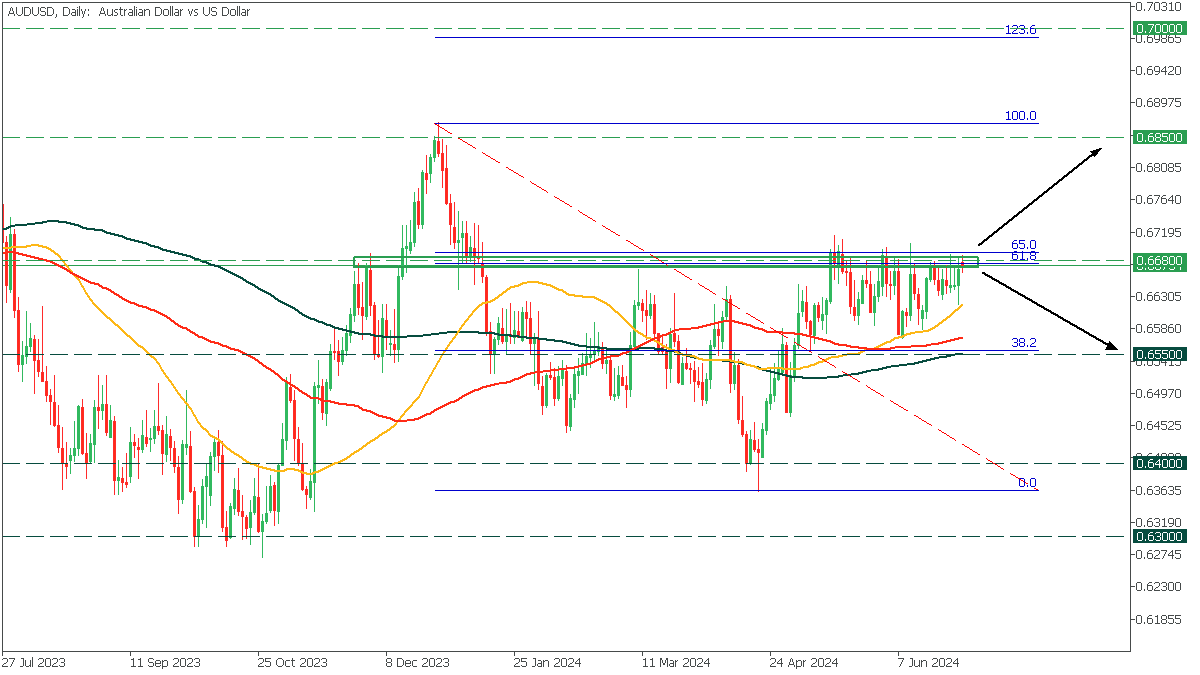
On the Daily chart, AUDUSD faces the crucial resistance zone at 0.6680, aligned with the Golden Fibonacci ratio. The price is above the MA’s, potentially indicating a bullish momentum for the asset.
- If the price breaks above the 0.6680 resistance, it may propel the asset to the 0.6850 level;
- However, rebounding of the Fibonacci ratio can trigger a decline to 0.6550 support.