A triangle chart pattern is a consolidation pattern that involves an asset price moving within a gradually narrowing range.
2023-01-25 • Updated
We are sure that you are familiar with technical analysis and trend lines in particular. In this case, you know that the trend-building carries a lot of subjectivity involved. Today we will explain to you the methods of trend-constructing and trend-trading by famous trader Victor Sperandeo, also known as “Trader Vic”. Together with Mr. Sperandeo, we will learn how to make trendlines work for you.
Who is Victor Sperandeo?
Trader Vic is a US trader, index developer, and financial commentator. He is known for trading commodities in the energy and metals sectors. An interesting fact: he predicted the stock market crash of 1987 (Black Monday). Before the crash, Victor Sperandeo shorted the Dow index and made 300% during a day.
The outstanding trading abilities of trader Vic helped him to create many useful and profitable strategies and techniques, which are relevant until now. The famous trendline method that we are going to explain to you below is one of them.
The trend-trading method by Trader Vic
Let’s consider the very simple method for trend trading described by Mr. Sperandeo. It is called “changing trends in the one-two-three”. Of course, it starts with the construction of a correct trendline.
From the basics of technical analysis, you remember that you need to draw a line between at least two points. If you consider an uptrend, you see a series of higher highs and higher lows. Alternatively, a downtrend is a series of lower lows and lower highs.
So, you opened a chart in MT4, and faced with the first problem: there are too many lines that you can potentially consider as “trendlines”. But which one of them is the right one? Let’s look at the algorithm of determining a good working trend by Trader Vic.
Let’s look at the step-by-step representations. Firstly, we will start with building an uptrend.
The uptrend is established. So, what should you do next? Let’s look at the picture below to understand the “one-two-three” method by Victor Sperandeo.
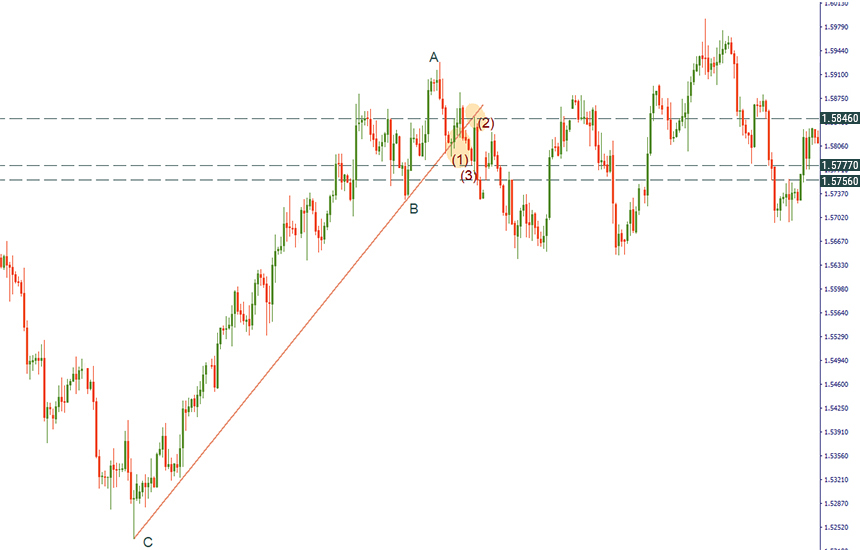
We can see an uptrend formed on the 4-hour chart of GBP/USD. After passing the “A” point, the trendline touched the price. It signaled about the change of a trend. The breakout of the trendline to the downside is called “one” (1) by trader Vic. After that, the price rises and retests the trendline. This is second (2) necessary condition of the reversal. At the same time, the low before the candlestick which caused a retest is considered as a level which needs to be broken to confirm the reversal. Thus, the break of the 1.5777 level is the third condition (3), after which we may open a short position. In our example, we opened a short position at the closing price of a candlestick after point (3) at 1.5756. Stop loss will be placed at the point (2), but the level of take profit needs to be trailed.

Now, let’s look at the scenario with a downward trend.
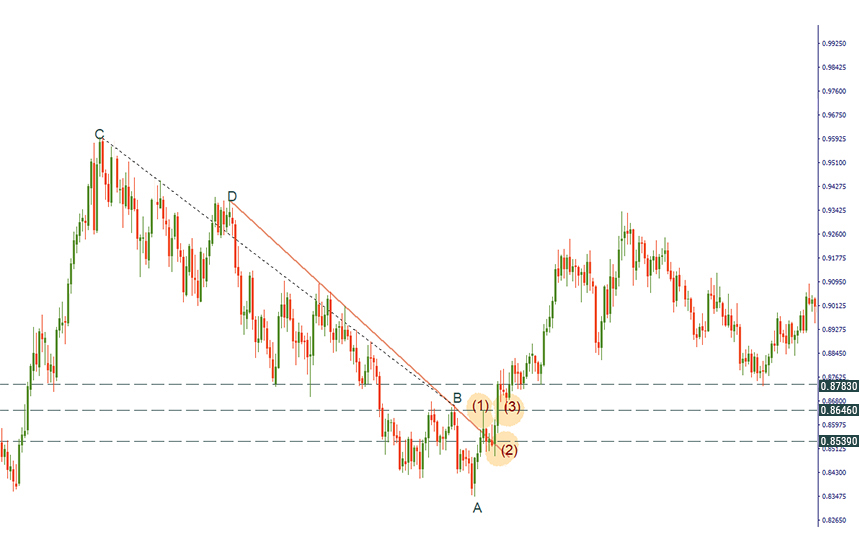
Now we are ready for some trend trading! After the price crossed the trendline (1st condition), we wait for the retest of the trendline. The high before the candlestick which caused a retest is considered as a level which needs to be broken to confirm the reversal. That means, the break of the 0.8646 level is the third condition (3), which may be considered as a signal to open a long position. On the picture below, we opened a position at the closing price of the candlestick after point (3) at 0.8738. Stop loss will be placed at the closing price of the candlestick, which caused a breakout at 0.8539. As for the level of take profit, we trail it.

Conclusion
Today we learned some tips on trend-construction and trading by the famous Trader Vic. Although the strategy seems easy, it requires practice and the knowledge of the basics of technical analysis.

A triangle chart pattern is a consolidation pattern that involves an asset price moving within a gradually narrowing range.

Sometimes a chart or a candlestick pattern may provide a decent entry signal if it is located at a certain level. A pin bar is one of the most reliable and famous candlestick patterns, and when traders see it on the chart, they expect the price to change its direction soon.

Among hundreds of different indicators and technical tools for traders, the relative strength index (RSI) is one of the most popular due to its simplicity and, at the same time, its power in various trading cases. In this article, we want to tell you about another powerful tool similar to RSI but with some cool tweaks.
If you are 18+ years old, you can join FBS and begin your FX journey. To trade, you need a brokerage account and sufficient knowledge on how assets behave in the financial markets. Start with studying the basics with our free educational materials and creating an FBS account. You may want to test the environment with virtual money with a Demo account. Once you are ready, enter the real market and trade to succeed.
Click the 'Open account' button on our website and proceed to the Trader Area. Before you can start trading, pass a profile verification. Confirm your email and phone number, get your ID verified. This procedure guarantees the safety of your funds and identity. Once you are done with all the checks, go to the preferred trading platform, and start trading.
The procedure is very straightforward. Go to the Withdrawal page on the website or the Finances section of the FBS Trader Area and access Withdrawal. You can get the earned money via the same payment system that you used for depositing. In case you funded the account via various methods, withdraw your profit via the same methods in the ratio according to the deposited sums.
FBS maintains a record of your data to run this website. By pressing the “Accept” button, you agree to our Privacy policy.
Your request is accepted.
A manager will call you shortly.
Next callback request for this phone number
will be available in
If you have an urgent issue please contact us via
Live chat
Internal error. Please try again later
Don’t waste your time – keep track of how NFP affects the US dollar and profit!
