

How to Trade Triangle Chart Patterns?
A triangle chart pattern is a consolidation pattern that involves an asset price moving within a gradually narrowing range.
2023-05-26 • Updated
Success comes from knowledge – this is true for most things in life and especially Forex trading. To become successful, a trader needs to learn technical analysis. Technical indicators are a big part of technical analysis.
The problem is that, at first sight, names of technical indicators can sound unpleasantly complicated, for example, MACD, RSI or Stochastic. However, we recommend you not to judge a book by its cover. We will provide you with a fair and simple explanation of the most popular technical indicators. We guarantee that you will understand how to use them. Are you interested? Let’s start then!
We trade to get a positive result or, in other words, profit. Many beginner traders are eager to know whether technical indicators are able to give them good trading signals.
The truth is that technical indicators won’t automatically lead you to profit, but they will do a lot of work for you. There are no doubts that a skillful and experienced trader can achieve profit without indicators, but they can still help a lot.
In fact, technical indicators can do a few wonderful things:
Every technical indicator is based on a mathematical formula. These formulas make fast calculations of various price parameters and then visualize the result on the chart. You don’t need to calculate anything yourself: just go to MetaTrader menu, click on “Insert” and then choose an indicator you would like to add to the chart.
At the same time, technical indicators make their calculations only on the basis of a price – the currency quotes, which are reordered in the trading software. As a result, indicators do have weak spots: they can give signals which lag behind the price (for example, the price has already fallen when the indicator finally gives a signal to sell).
The good news is that there are ways to get a lot of benefits from technical indicators. We are going to explain how to do it in the paragraph that follows.
Technical indicators are divided into several groups depending on their purpose. As purposes of the indicators are different, a trader needs not one, but a combination of several indicators to open a trade. In this article, we will tell about the 3 most popular technical indicators.
Moving Average (MA) is a trend indicator. It helps to identify and follow the trend.
Technical principle: MA shows an average value of a price over a chosen time period.
In simple terms: Moving Average follows the price. This line helps to smooth the price volatility and get rid of the unwanted price “noise”, so that you focus on the main trend and not on corrections. It is necessary to understand that this indicator does not predict the future price, but outlines the current direction of the market.
Advantages of Moving Average:
Disadvantages of Moving Average:
Tips:
How to interpret
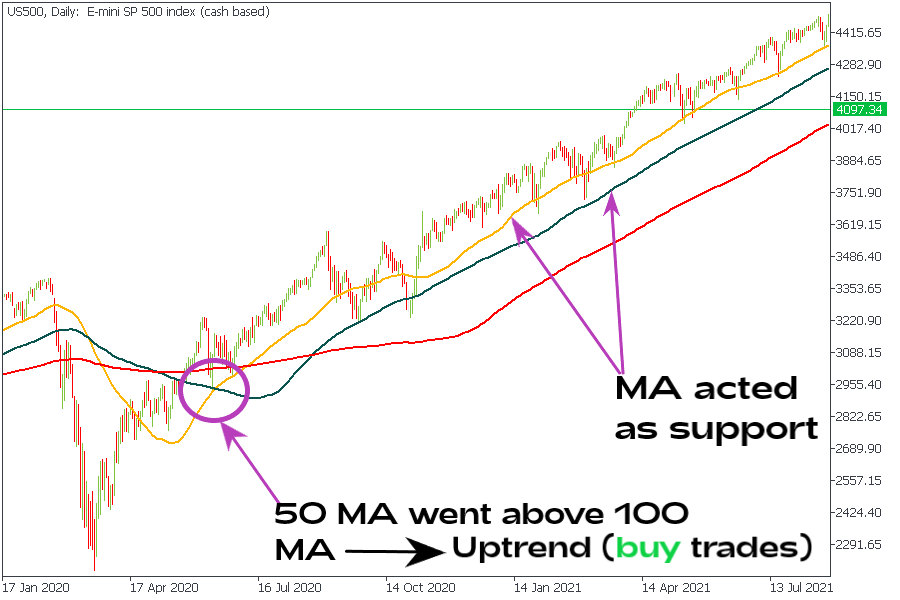
In short, a trend is bullish when the price of a currency pair is above the MA and bearish – when the price falls below. In addition, note how Moving Averages with different periods behave towards each other.
Upward bias is confirmed when a shorter-term MA (e.g. 50-period) rises above the longer-term MA (e.g. 100-period). And vice versa, a downward bias is confirmed when a shorter-term MA goes below the longer-term MA.
Conclusion
Moving Average shows whether to buy or sell a currency pair (buy in an uptrend, sell in a downtrend). MA won’t tell you at what level to open your trade (for that you’ll need other indicators). As a result, applying a trend indicator should be among the first steps of your technical analysis.
Bollinger Bands helps to measure market volatility (i.e. the degree of variation of a trading price).
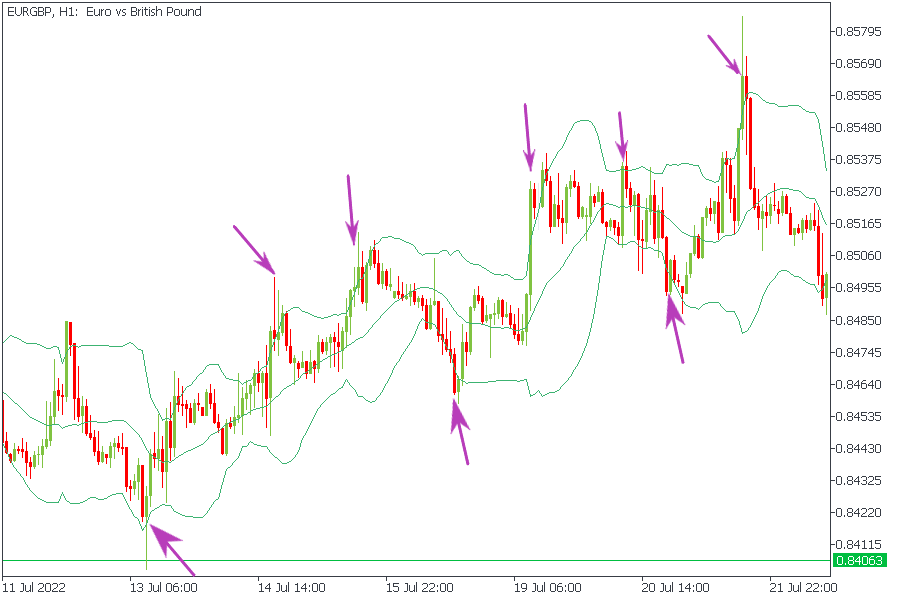
Technical principle: Bollinger Bands consist of 3 lines. Each line (band) is an MA. The middle band is usually a 20-period SMA. It identifies trend direction – just like the MAs described above do. Upper and lower bands (or “volatility” bands) are shifted by two standard deviations above and below the middle band.
In simple terms: Bollinger Bands indicator puts the price in a kind of box between the two outside lines. The price is constantly revolving around the middle line. It can go and test levels beyond the outside lines, but only for a short period of time and it won’t be able to get far away. After such deviation from the center, the price will have to return back to the middle. You can also notice that during some periods of time Bollinger lines come closer together, while during other periods of time they spread and the range becomes wider. The narrower the range, the lower is market volatility and, vice versa, the bands widen when the market becomes more volatile.
Advantages of Bollinger Bands:
Disadvantages of Bollinger Bands:
How to interpret
The closer the price approaches the upper band, the more overbought the currency pair becomes. To put it simply, by this time buyers have already made money on the advance of the price and close their trade to take profit. The result is that the overbought pair stops rising and turns down. The price's rise above the upper band may be a selling signal, while a decline below the lower band – a buying signal.
The outer bands automatically widen when volatility increases and narrow when volatility decreases. High and low volatility periods usually follow each other, so the narrowing of the bands often means that the volatility is about to increase sharply.
Tips:
Conclusion
Bollinger Bands work best when the market is not trending. This indicator can be a great basis for a trading system, but it alone is not enough: you’ll need to use other tools as well.
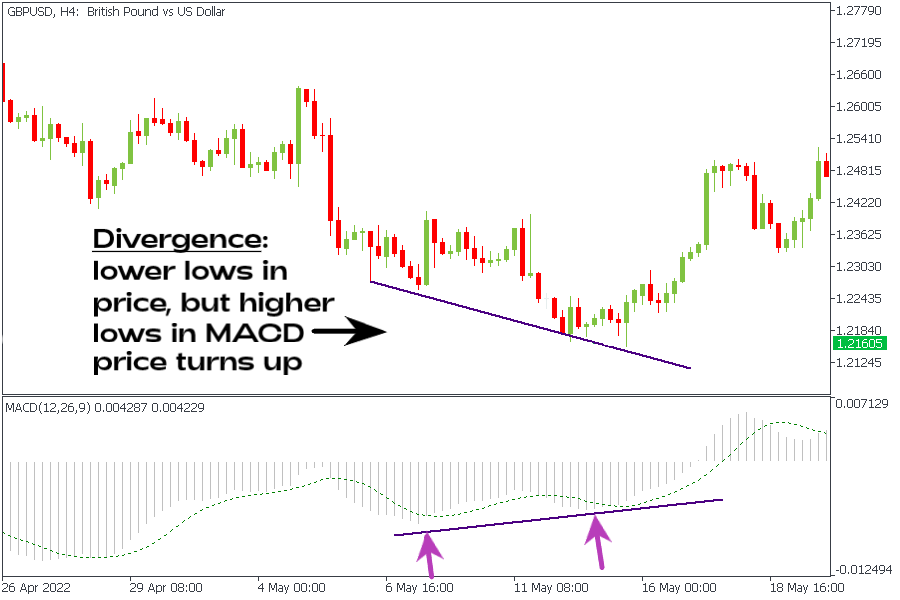
MACD (Moving Average Convergence/Divergence) measures the driving force behind the market. It shows when the market gets tired of moving in one direction and needs a rest (correction).
Technical principle: MACD histogram is the difference between a 26-period and 12-period exponential moving averages (EMA). It also includes a signal line (9-period moving average).
In simple terms: MACD is based on moving averages, but it involves some other formulas as well, so it belongs to a type of technical indicators known oscillators. Oscillators are shown in separate boxes below the price chart. After an oscillator rises to high levels, it has to turn back down. Usually so does the price chart. The difference is that while MACD needs to return close to 0 or lower, the price’s decline will likely be smaller. This is how MACD “predicts” the turns in price.
How to interpret
Tips
Advantages of MACD:
Disadvantages of MACD:
Conclusion
It’s good to have MACD on your chart as it measures both trend and momentum. It can be a strong part of a trading system, although we don’t recommend to make trading decisions based only on this indicator.

A triangle chart pattern is a consolidation pattern that involves an asset price moving within a gradually narrowing range.

Sometimes a chart or a candlestick pattern may provide a decent entry signal if it is located at a certain level. A pin bar is one of the most reliable and famous candlestick patterns, and when traders see it on the chart, they expect the price to change its direction soon.

Doji candles are rare birds, but if you catch them, it can be a great chance to seize the right entry moment. This article will discuss what a Doji candle is. You will also get a Doji strategy that can bring profit.
If you are 18+ years old, you can join FBS and begin your FX journey. To trade, you need a brokerage account and sufficient knowledge on how assets behave in the financial markets. Start with studying the basics with our free educational materials and creating an FBS account. You may want to test the environment with virtual money with a Demo account. Once you are ready, enter the real market and trade to succeed.
Click the 'Open account' button on our website and proceed to the Trader Area. Before you can start trading, pass a profile verification. Confirm your email and phone number, get your ID verified. This procedure guarantees the safety of your funds and identity. Once you are done with all the checks, go to the preferred trading platform, and start trading.
The procedure is very straightforward. Go to the Withdrawal page on the website or the Finances section of the FBS Trader Area and access Withdrawal. You can get the earned money via the same payment system that you used for depositing. In case you funded the account via various methods, withdraw your profit via the same methods in the ratio according to the deposited sums.
FBS maintains a record of your data to run this website. By pressing the “Accept” button, you agree to our Privacy policy.
Your request is accepted.
A manager will call you shortly.
Next callback request for this phone number
will be available in
If you have an urgent issue please contact us via
Live chat
Internal error. Please try again later
Don’t waste your time – keep track of how NFP affects the US dollar and profit!
|


