Is Ross Hook the Most Powerful Price Action Pattern?

Is Ross Hook the Most Powerful Price Action Pattern?

2023-01-25 • Updated

As you know, technical analysts rely on the past of the price to predict its future. Some traders try to prove this way of trading to be wrong and unprofitable. But we want to show you the Ross Hook, the pattern, that is proven to be profitable for 32 years already.

Introduction?

The Ross Hook (RH) trading strategy is a 100% price action strategy based on the retest of 1-2-3 pattern breakout. If you haven’t read about the 1-2-3 reversal pattern, be sure to check it out first!

Also, I must warn you, if you are new in trading, trying to find a ross hook pattern on your chart may be quite difficult at first. Why? Because you need to identify 1-2-3 pattern correctly, and after that wait for Hook to emerge. That can be confusing at first but I’m sure you can deal with it!

How to find a Hook?

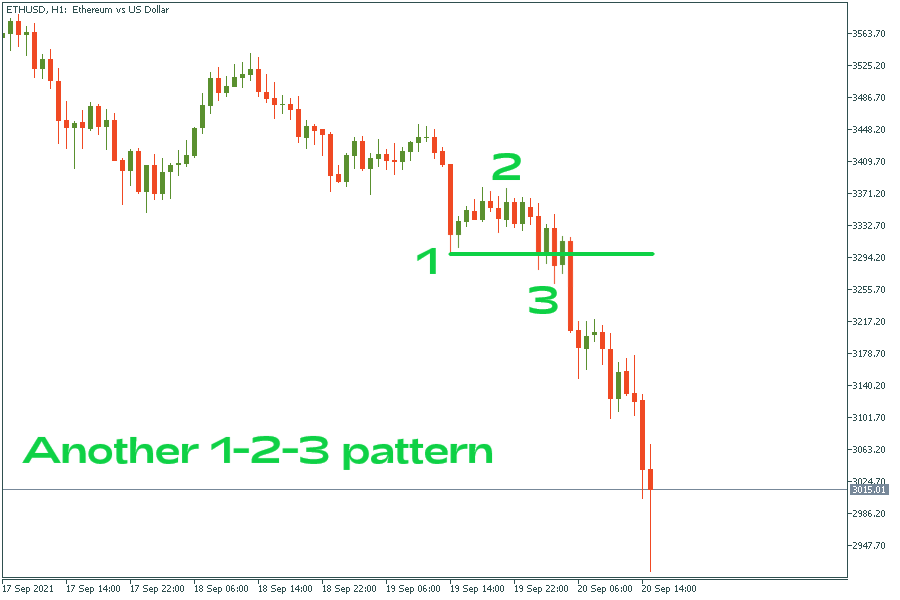
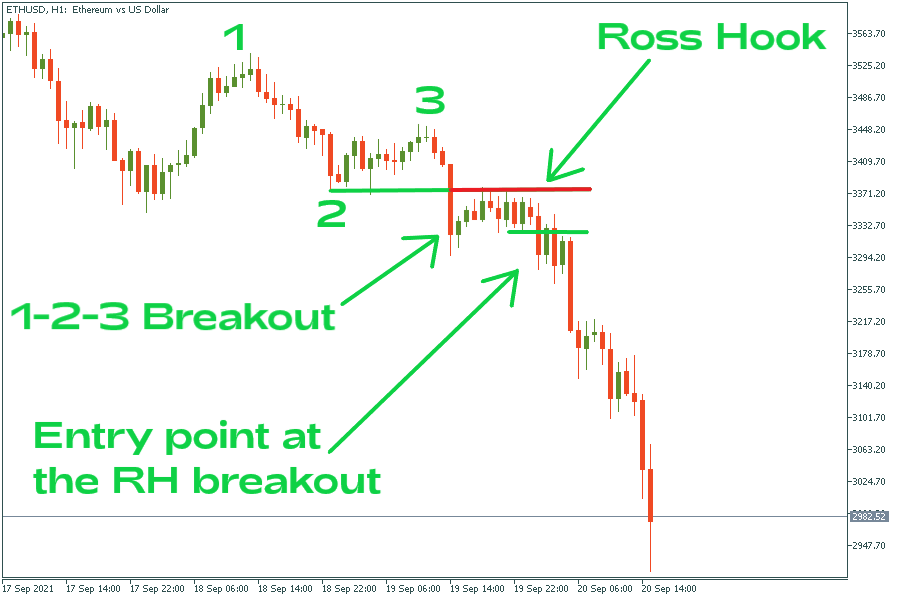
I don’t want you to get confused here because RH pattern is really useful, so I’ll explain everything as simply as I can. Look at the ordinary 1-2-3 pattern, and then at the Ross Hook.
ETHUSDH1.png

Now, look closely at the RH.

2- ETHUSDH1.png

Do you see it? The Ross Hook is just a smaller 1-2-3 pattern that is formed after the bigger one!

Now, everything you need to do is to find this “double 1-2-3 pattern” (that’s not an official name, but simplicity is the key).

Ross Hook Trading Strategy

To trade the RH pattern, we need to follow several steps:

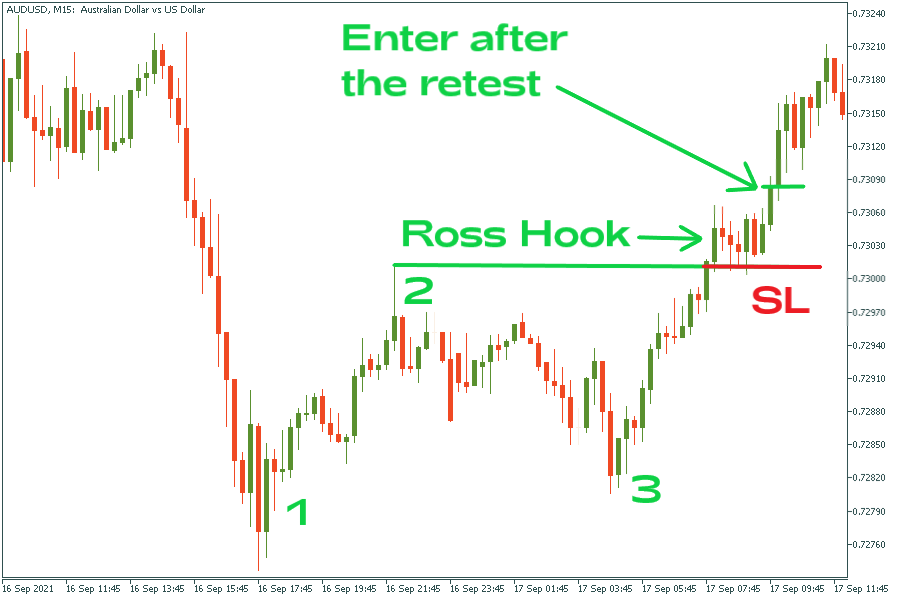
  1. Find a 1-2-3 pattern.
  2. Wait for violation candlestick to emerge (it is considered to happen at the breakout of point 2 of the 1-2-3 pattern).
  3. Open a trade after the point 2 retest.

Look at the picture to get it right. We have waited for the 1-2-3 pattern to emerge, then we opened a trade after the retest and put stop loss (SL) below the retest level.
 AUDUSDM15.png

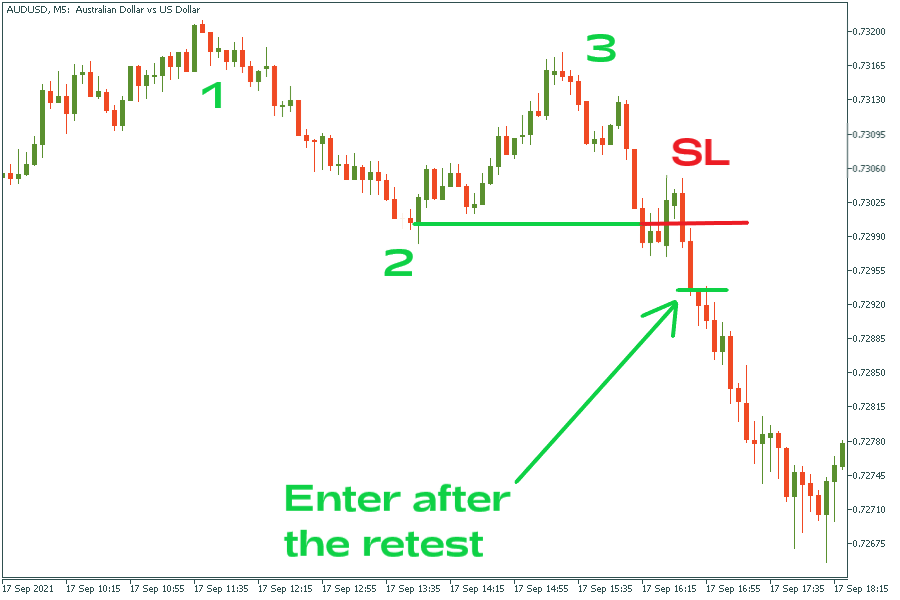
Now, let’s analyze a short trade:

We have identified a pattern, waited for Ross Hook to form, and entered after the retest.
2- AUDUSDM5.png

You can measure your take profit differently:

  1. Measure the distance between point 1 and RH and use that as your take profit.
  2. Multiply the distance from the entry point to stop loss by 2 or 3 and put your take profit here. You can put several take profits and move your stop loss after the price will hit the first target. This way you will get less unprofitable trades.
  3. Do not set take profit. Instead of it move your stop losses behind each peak or low point that forms as your trade moves. In a good trending market, this will allow you to ride the trend most of the way and capture way more profit.

Why Ross Hook?

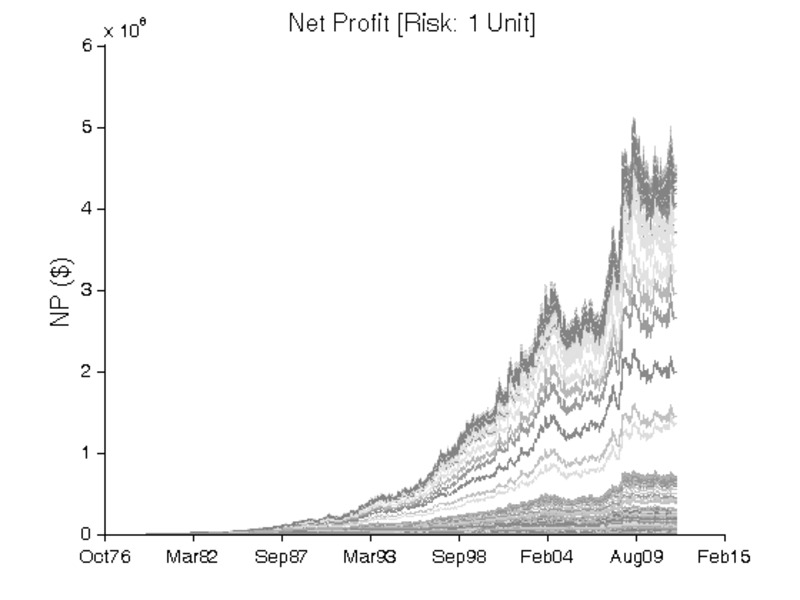
First of all, I want to prove the usability of the pattern. Analysts from Oxford University have tested this strategy on 42 different assets (including forex pairs, futures, and stocks) over 32 year period. Starting with $1 million and having a risk of 1% per trade the strategy has proven to be profitable. If you have traded with this strategy, you would have made more than $5 million net profit.
imgonline-com-ua-Resize-DczUQ9EMGyY.jpg

Let’s sum up:

Pros:

  1. Price-action based. You don’t need anything except a chart.
  2. Tested on vast periods and have proven to be profitable for decades.
  3. Good risk-to-reward ratio (up to 1:3 or even more, which is amazing).
  4. You can trade on a 1-2-3 pattern while waiting for the RH to emerge.

Cons:

  1. Entry points aren’t so often as on some other strategies.
  2. You need to identify 1-2-3 and RH patterns and filter false price movements.
  3. Nothing is ever perfect in trading, there will be false breakouts of RH and your stop loss can get hit.

LOG IN

Similar

Pin Bar Trading Strategy

Sometimes a chart or a candlestick pattern may provide a decent entry signal if it is located at a certain level. A pin bar is one of the most reliable and famous candlestick patterns, and when traders see it on the chart, they expect the price to change its direction soon.

Money Flow Index Trading Strategies

Among hundreds of different indicators and technical tools for traders, the relative strength index (RSI) is one of the most popular due to its simplicity and, at the same time, its power in various trading cases. In this article, we want to tell you about another powerful tool similar to RSI but with some cool tweaks.

Easy Intraday Strategy (Candlestick Patterns + RSI)

There are a lot of valuable strategies that require the knowledge of candlestick patterns and oscillators. However, not of them are profitable. When you start trading with them, you can face situations when the strategy is not moving your way.

Frequently asked questions

  • How to start trading?

    If you are 18+ years old, you can join FBS and begin your FX journey. To trade, you need a brokerage account and sufficient knowledge on how assets behave in the financial markets. Start with studying the basics with our free educational materials and creating an FBS account. You may want to test the environment with virtual money with a Demo account. Once you are ready, enter the real market and trade to succeed.

  • How to open an FBS account?

    Click the 'Open account' button on our website and proceed to the Trader Area. Before you can start trading, pass a profile verification. Confirm your email and phone number, get your ID verified. This procedure guarantees the safety of your funds and identity. Once you are done with all the checks, go to the preferred trading platform, and start trading.

  • How to withdraw the money you earned with FBS?

    The procedure is very straightforward. Go to the Withdrawal page on the website or the Finances section of the FBS Trader Area and access Withdrawal. You can get the earned money via the same payment system that you used for depositing. In case you funded the account via various methods, withdraw your profit via the same methods in the ratio according to the deposited sums.

Deposit with your local payment systems

Data collection notice

FBS maintains a record of your data to run this website. By pressing the “Accept” button, you agree to our Privacy policy.

Callback

A manager will call you shortly.

Change number

Your request is accepted.

A manager will call you shortly.

Next callback request for this phone number
will be available in

If you have an urgent issue please contact us via
Live chat

Internal error. Please try again later

Don’t waste your time – keep track of how NFP affects the US dollar and profit!

You are using an older version of your browser.

Update it to the latest version or try another one for a safer, more comfortable and productive trading experience.

Safari Chrome Firefox Opera