

What to choose: full-time or part-time trading in 2023?
Struggling to choose between part-time and full-time trading? Then this article is for you!
2024-05-30 • Updated
When a beginner trader is looking for information how to start trading with profit, he/she usually comes across an advice to follow a trend. If the currency pair is rising, it’s necessary to buy. If it’s falling, the recommendation is to sell. Indeed, there’s much sense in this recommendation. Yet, when it comes to practice, it becomes clear that everything is not so simple. To profit from trend trading, you will need more detailed instructions. This article will guide you through trend trading strategies and will give you a number of steps to make.
There are different trends
Before you start opening trades in MetaTrader, you need to know that there are 3 types of trends in terms of time:
When traders ask us “What trend is there on the EUR/USD chart?” we usually ask “Which timeframe do you mean?” Indeed, if you check different timeframes for EUR/USD, the charts you will see may differ a lot.
Long-term trends may last for 8 months – 2 years. They show the bigger picture and reflect the difference in economic strength of the countries the currencies of which form a currency pair, for example, the euro area and the United States. Intermediate trends last for 1-8 months. They are formed within the primary long-term trends in the opposite direction. Short-term trends can last for several days and up to a month. They appear because of global capital flows caused by economic and political news. Such trends allow traders to make profit during a few hours.
It’s necessary to remember that even if you trade only during the day, you need to know not only the short-term but also the long-term and medium-term trends and draw their trend lines. Sometimes the price can meet resistance or support of a bigger trend. If you identify all three types of trends on your chart, you will have a better view of the market.
Stages of a trend
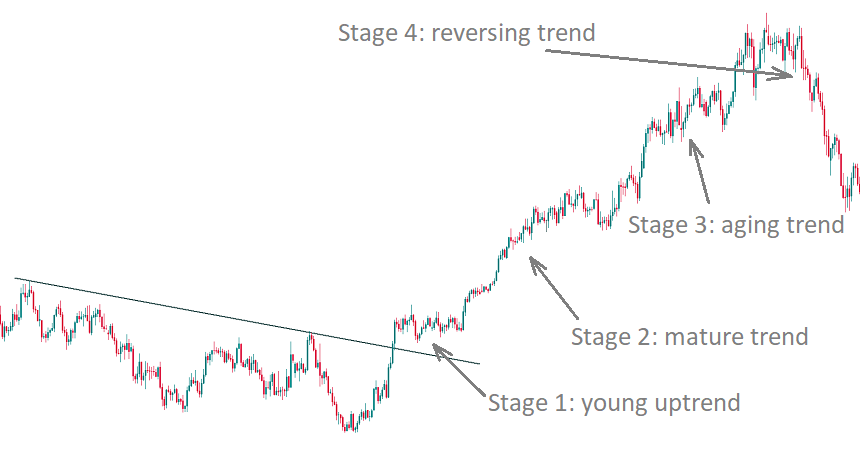
The next important thing is that every trend consists of 4 stages:
If a trend is already old, there’s no point in trying to trade it. The goal is to catch a trend at its beginning or during the early stage of its maturity. This way you will be able to get a good profit from trading the trend.
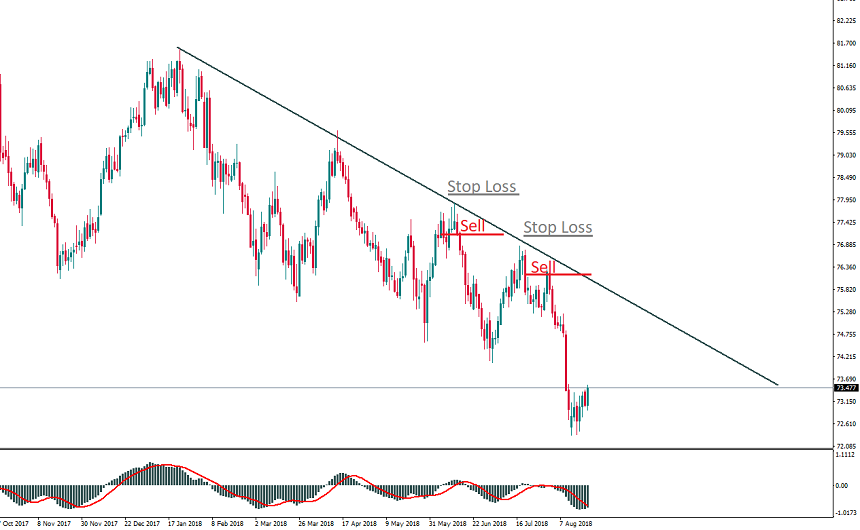
So, you should be looking for stage 2. At this point, you will be able to draw trend lines. For an uptrend, you will need at least 2 lows – the initial low and the higher low. If you have 3 lows to connect that’s even better – it would mean that a trend has really formed. The trend line will be a support line. For a downtrend, you will need at least 2 highs – the first high and the second, lower high. The same thing: it would be even better to connect 3 highs. In this case, the trend line will be a resistance line.
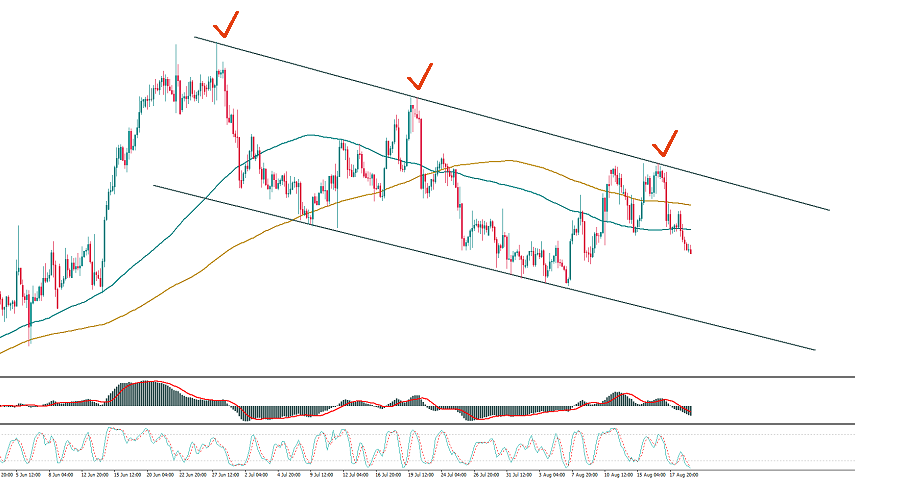
It’s very important that you don’t get lazy and make effort to draw the trend lines. They represent a simple but efficient tool of chart analysis. Not only will they help to find the areas where in future the price may bounce from support or resistance, but they will also show how strong a trend is. Go with this observation: the steeper the trend line, the bigger the chance that it will be broken by the price. If the price moves rapidly up, buyers who push it higher will soon run out of strength, and the market will reverse. If you want to pick a good trend that will last for a considerable time, choose the one with less steep trend lines.
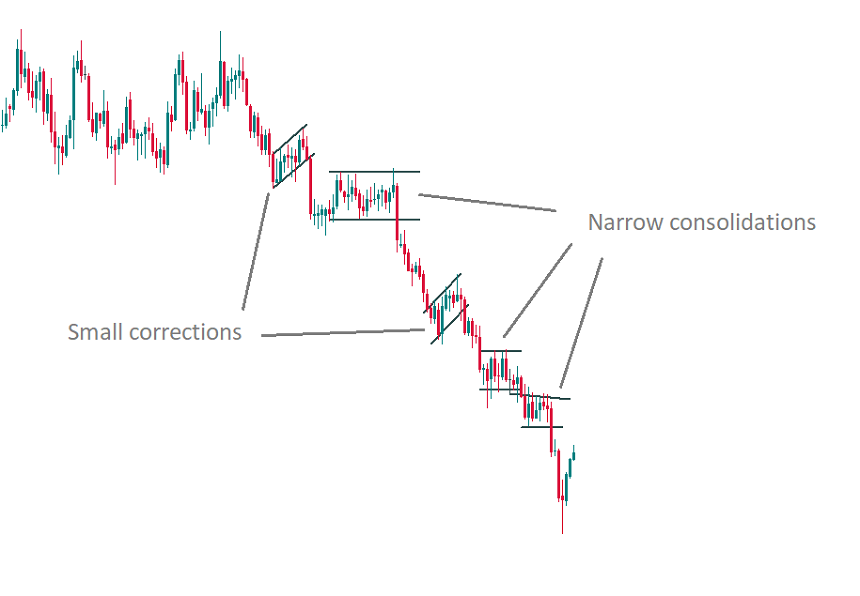
We also advise you to look at the corrections and consolidations that take place during your trends. As you can see, even when the price has a tendency to move up or down, it doesn’t go straight up or straight down all the time. A correction is when a currency pair pulls back in the direction opposite to that of the main trend. A consolidation is a period of a horizontal movement of the price.
If the periods of counter-trend movement (corrections) are short and sideways ranges (consolidations) are narrow, you have found a solid strong trend and are safe to trade it.
Technical indicators
There’s a group of indicators in MT4 which are called “Trend indicators”. They can help you to ride a trend.
Moving Average will help to identify an uptrend or a downtrend and act as support and resistance. We recommend using simple moving averages with periods of 20, 50, 100 and 200.
ADX shows the direction and the strength of a trend. Readings above 30 indicate a strong trend. Note that this indicator can be slow.
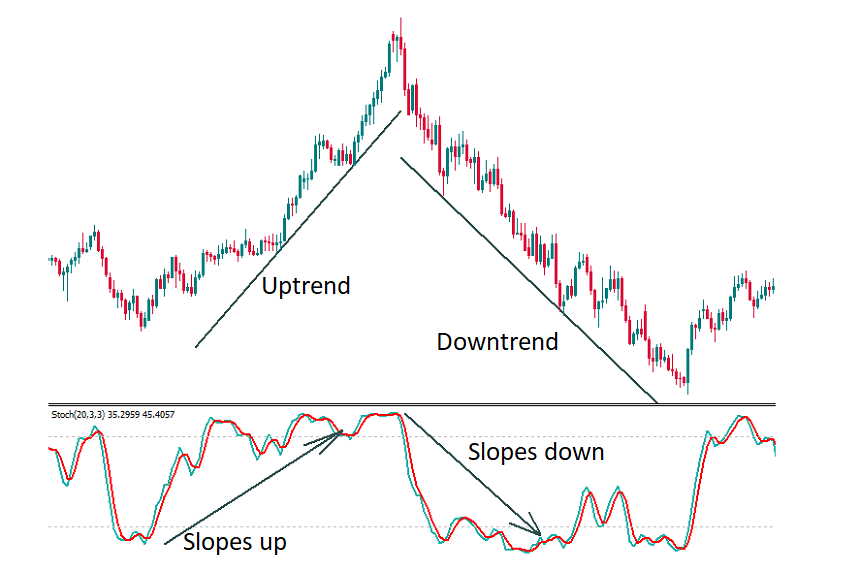
Traders can also use oscillators (indicators which oscillate around some central value and are shown in a separate window below the price chart). After you have determined the direction of the trend using trend lines or moving averages, check Stochastic oscillator. In an uptrend, its slope should be strongly up. In a downtrend, the Stochastic has to slope strongly down. If the price is making new highs in an uptrend, but Stochastic is not, it may signal a reversal down.
You can get similar data to those provided by the Stochastic indicator from another oscillator called MACD. The difference is that MACD comes in form of a histogram (columns below the price chart). During an uptrend, MACD columns should become bigger, while during a downtrend they should decline and then get to the negative area.
A strategy for trading using a trend
The best way is to go along with the market. Here are the recommended steps:

Struggling to choose between part-time and full-time trading? Then this article is for you!

A triangle chart pattern is a consolidation pattern that involves an asset price moving within a gradually narrowing range.

Sometimes a chart or a candlestick pattern may provide a decent entry signal if it is located at a certain level. A pin bar is one of the most reliable and famous candlestick patterns, and when traders see it on the chart, they expect the price to change its direction soon.
If you are 18+ years old, you can join FBS and begin your FX journey. To trade, you need a brokerage account and sufficient knowledge on how assets behave in the financial markets. Start with studying the basics with our free educational materials and creating an FBS account. You may want to test the environment with virtual money with a Demo account. Once you are ready, enter the real market and trade to succeed.
Click the 'Open account' button on our website and proceed to the Trader Area. Before you can start trading, pass a profile verification. Confirm your email and phone number, get your ID verified. This procedure guarantees the safety of your funds and identity. Once you are done with all the checks, go to the preferred trading platform, and start trading.
The procedure is very straightforward. Go to the Withdrawal page on the website or the Finances section of the FBS Trader Area and access Withdrawal. You can get the earned money via the same payment system that you used for depositing. In case you funded the account via various methods, withdraw your profit via the same methods in the ratio according to the deposited sums.
FBS maintains a record of your data to run this website. By pressing the “Accept” button, you agree to our Privacy policy.
Your request is accepted.
A manager will call you shortly.
Next callback request for this phone number
will be available in
If you have an urgent issue please contact us via
Live chat
Internal error. Please try again later
Don’t waste your time – keep track of how NFP affects the US dollar and profit!
|


