Struggling to choose between part-time and full-time trading? Then this article is for you!
2023-04-03 • Updated
While trying to find a perfect balance between day trading strategy and scalping, traders may discover an attractive in-between style. The name of the article speaks for itself: today we are going to talk about swing trading. So, what is swing trading?
Swing trading is a specific approach to trading, which combines fundamental and technical analyses. Trading swings reminds of surfing: you catch the swings when the price changes direction. If you choose this trading style, you hold your position for several days. Therefore, you should be familiar with the main principles of position size management and the mechanism of swaps.
You’ve probably guessed that swing trading works perfectly during sideways markets, as in that situation the price fluctuates within certain levels. At the same time, “swing-catching” is also possible when a price makes corrections within a trend.
If the swing trading sounds too complicated for you, we will be happy to reassure you with a good swing strategy called “H4 crossover”. Its rules are as simple as its name! Let’s look at the details.
Don’t forget about money management. Your maximum risk and profit target per trade should equal about 1-2% of the account balance.
The steps for the strategy will be, as usual, presented for both “sell” and “buy” scenarios.
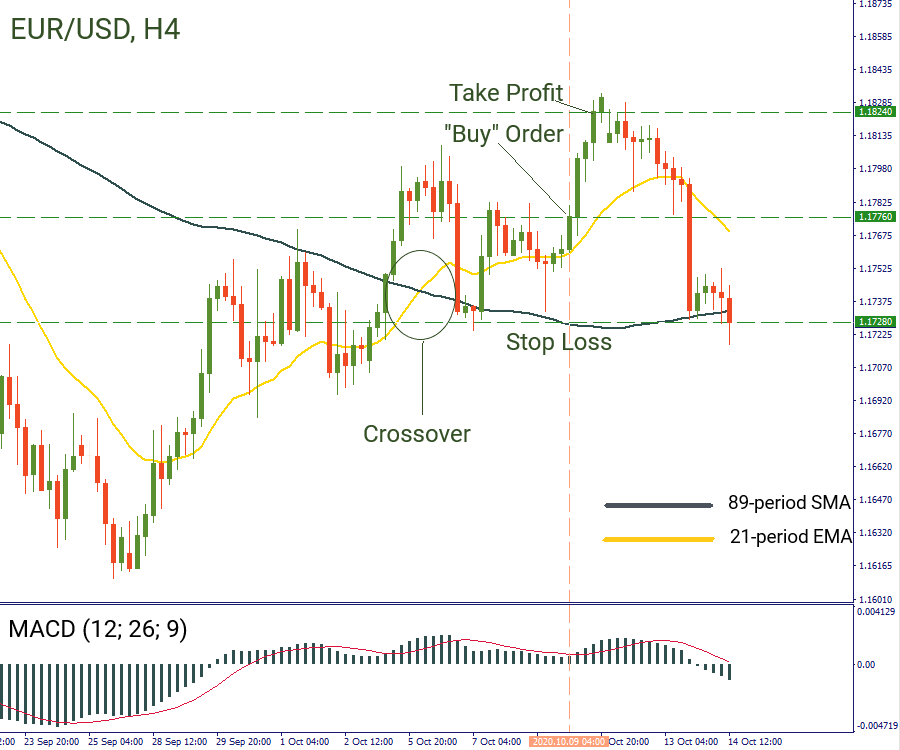
Below we provided an example of the strategy on the H4 chart of EUR/USD.

In the chart, we can see that the 21-period EMA (yellow line) broke above the 89-period SMA (grey line) on October 6. The price jumped higher, but then corrected downwards. At the same time, MACD was going down. We waited for the price to rise back above the moving averages and for MACD to go up. After that, we opened a position at 1.1776 (closing price of the bullish candlestick). We placed Stop Loss 5 pips below the support at 1.1728. The level of Take Profit was placed at the same distance between the “buy” order and the Stop Loss, which is 48 pips. As a result, our Take Profit went to: 1.1776+48=1.1824.

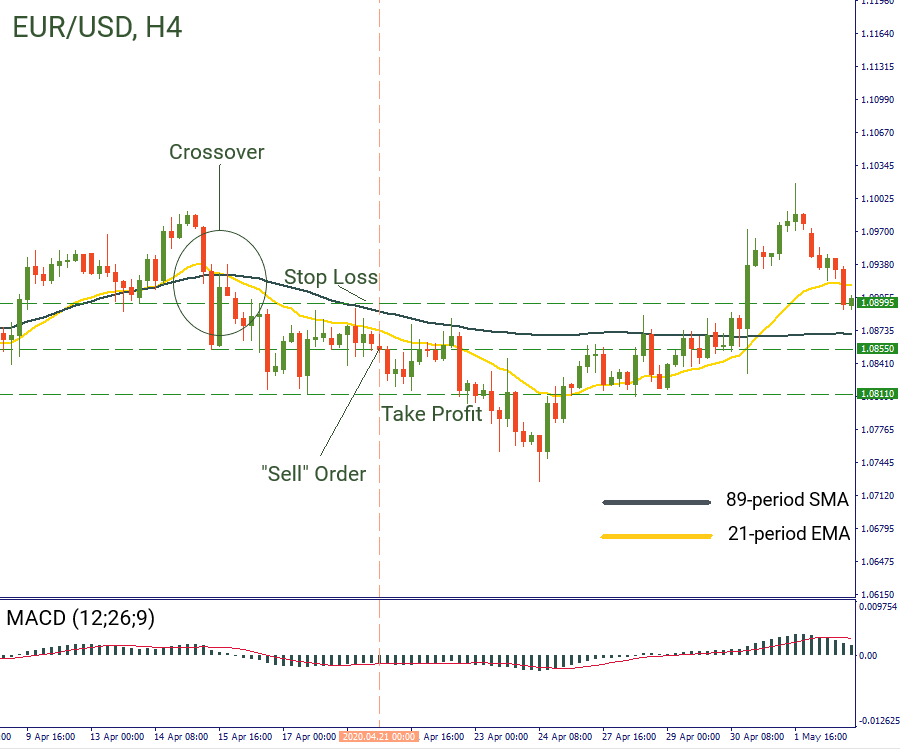
In the same chart of EUR/USD, we saw that that the 21-period EMA (yellow line) broke below the 89-period SMA (grey line). The price then moved down and up. MACD was moving higher as well. We waited for the oscillator to reverse and opened a “sell” order at the closing price of the red candlestick. Stop loss was located above the resistance level at 1.0899, while take profit was put at 1.0811 (1.0855-0.0044=1.0811).
This strategy seems pretty easy, right? By following the simple rules explained above you can master swing trading quite effectively. We recommend you to try it out on the demo account first for backtesting and then implement it in the real market environment.

Struggling to choose between part-time and full-time trading? Then this article is for you!

A triangle chart pattern is a consolidation pattern that involves an asset price moving within a gradually narrowing range.

Sometimes a chart or a candlestick pattern may provide a decent entry signal if it is located at a certain level. A pin bar is one of the most reliable and famous candlestick patterns, and when traders see it on the chart, they expect the price to change its direction soon.
If you are 18+ years old, you can join FBS and begin your FX journey. To trade, you need a brokerage account and sufficient knowledge on how assets behave in the financial markets. Start with studying the basics with our free educational materials and creating an FBS account. You may want to test the environment with virtual money with a Demo account. Once you are ready, enter the real market and trade to succeed.
Click the 'Open account' button on our website and proceed to the Trader Area. Before you can start trading, pass a profile verification. Confirm your email and phone number, get your ID verified. This procedure guarantees the safety of your funds and identity. Once you are done with all the checks, go to the preferred trading platform, and start trading.
The procedure is very straightforward. Go to the Withdrawal page on the website or the Finances section of the FBS Trader Area and access Withdrawal. You can get the earned money via the same payment system that you used for depositing. In case you funded the account via various methods, withdraw your profit via the same methods in the ratio according to the deposited sums.
FBS maintains a record of your data to run this website. By pressing the “Accept” button, you agree to our Privacy policy.
Your request is accepted.
A manager will call you shortly.
Next callback request for this phone number
will be available in
If you have an urgent issue please contact us via
Live chat
Internal error. Please try again later
Don’t waste your time – keep track of how NFP affects the US dollar and profit!
