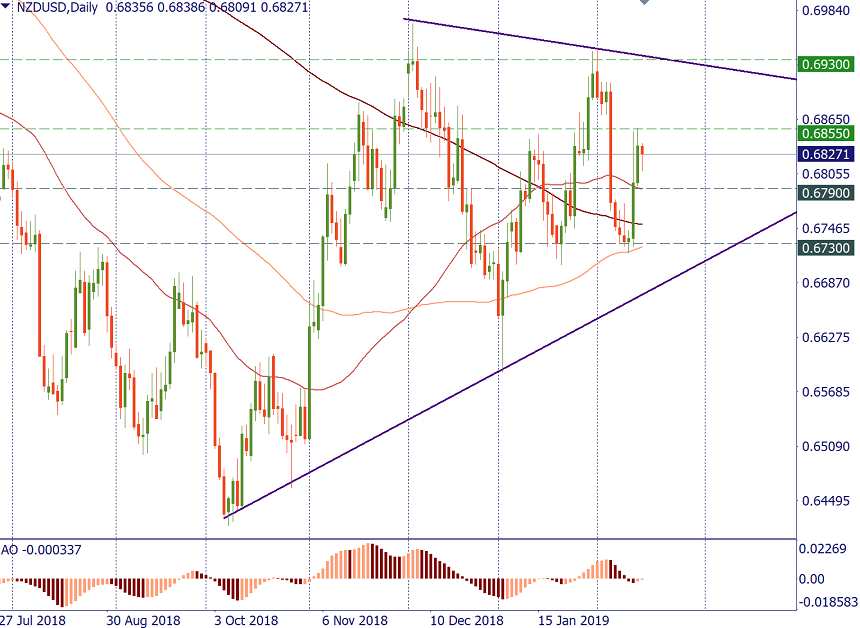
Technical levels for NZD/USD
Trade ideas
BUY 0.6865; TP 0.6930; SL 0.6845
SELL 0.6790: TP 0.6730; SL 0.6810
NZD/USD has gone through a lot during the past days. The pair is greatly influenced by the constant changes in global risk sentiment as well as the policy of the central banks. If we look at the chart, we’ll see that the NZD tends to move sideways as it lacks significant momentum in either direction.
Yet, the previous highs and lows form very distinct support and resistance levels providing us with the framework for trading. As a result, a break of the nearest levels will lead the pair either to the December-February resistance line or the 100-day MA.
