Best Trade Ideas for April
Hey guys! So, April is fast approaching, and there's already an array of over 30 high-impact news releases; that is, almost every single trading day! As a result, in order to be better positioned to 'milk' all of these volatile events in the market, here are a few trade ideas to consider.
Disclaimer: Now, I know we've had quite an amazing run these past few month, with over 78% accuracy in our trade ideas and sentiments, and thousands of pips in profits monthly, you must know I am not a 100% accurate AI. So, do not bet all your money on these ideas without proper risk management!
XAUUSD
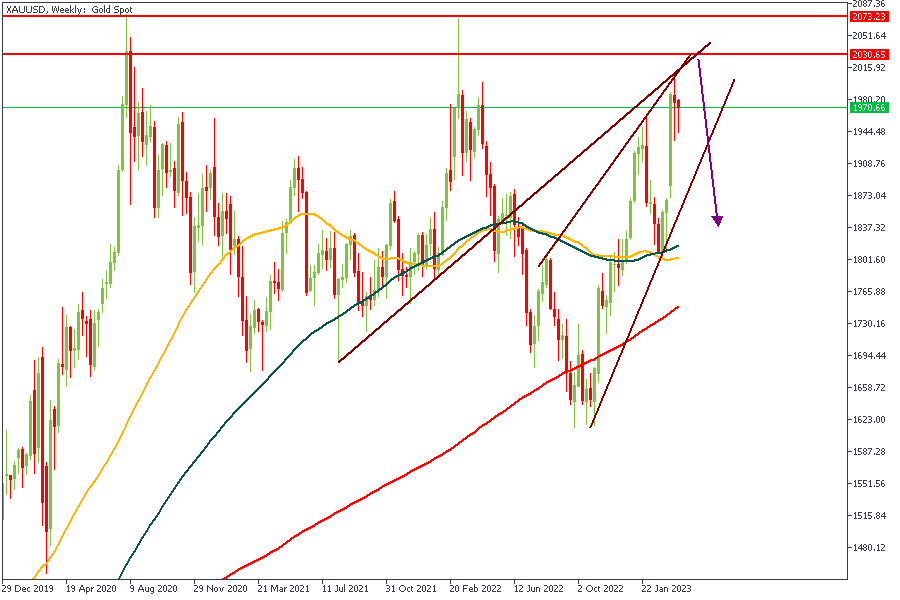
Here is our dear friend Gold, from the weekly timeframe. We can clearly see price confined within a rising wedge, and approaching a major area of resistance (a pivot zone). There is also a supply zone at the peak of the inducement candle (that previous rejection candle with the long wick). Based on the confluence of the two resistance trendlines, the supply zone, the pivot zone, and the 88% Fibonacci retracement level, I am quite confident of this playing out.
Analysts’ Expectations:
Direction: Bearish
Target: $1842
Invalidation: $2074
NZDCAD
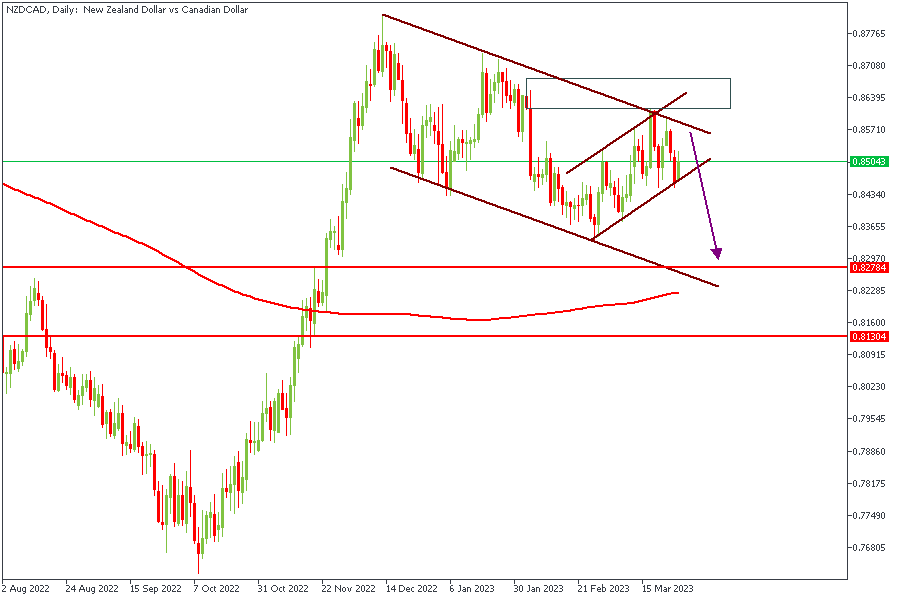
NZDCAD is currently trading within a rising channel that is inside a bigger descending channel, and has recently been rejected from the resistance trendline of the channel. I expect price to head into the supply zone once more for a confirmed bearish push. Once price breaks through the support trendline, it would sail very quickly towards the 200-Day MA.
Analysts’ Expectations:
Direction: Bearish
Target: 0.83000
Invalidation: 0.85800
EURNZD
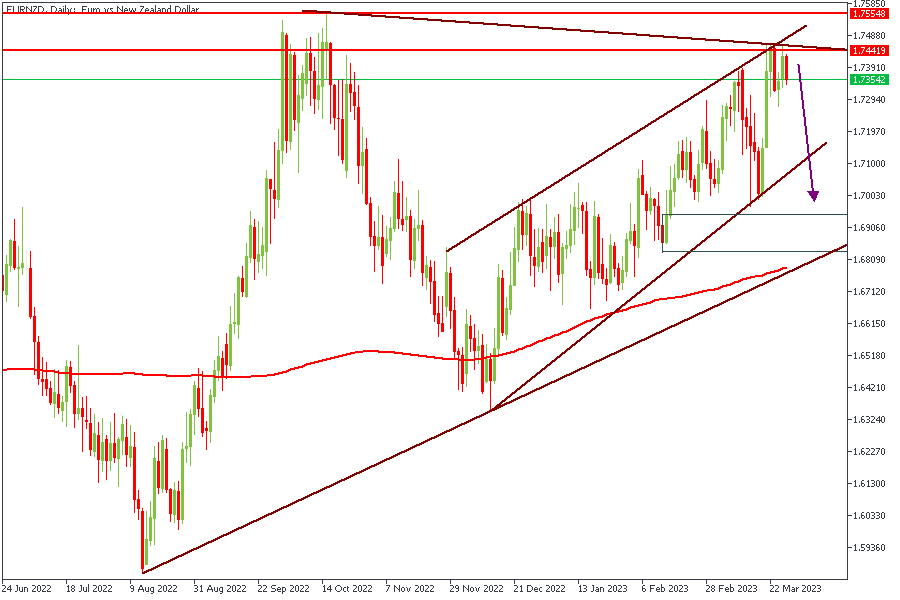
EURNZD is at a cruciall point on the Daily timeframe. First of all, we have the resistance trendline from the previous high, then followed by the resistance trendline from the rising wedge. Don't forget, we also have the resistance zone and a rally-base-drop supply zone at the site of the price action. All these combined to give me a clear bearish sentiment.
Analysts’ Expectations:
Direction: Bearish
Target: 1.75700
Invalidation: 1.69450
GBPCHF
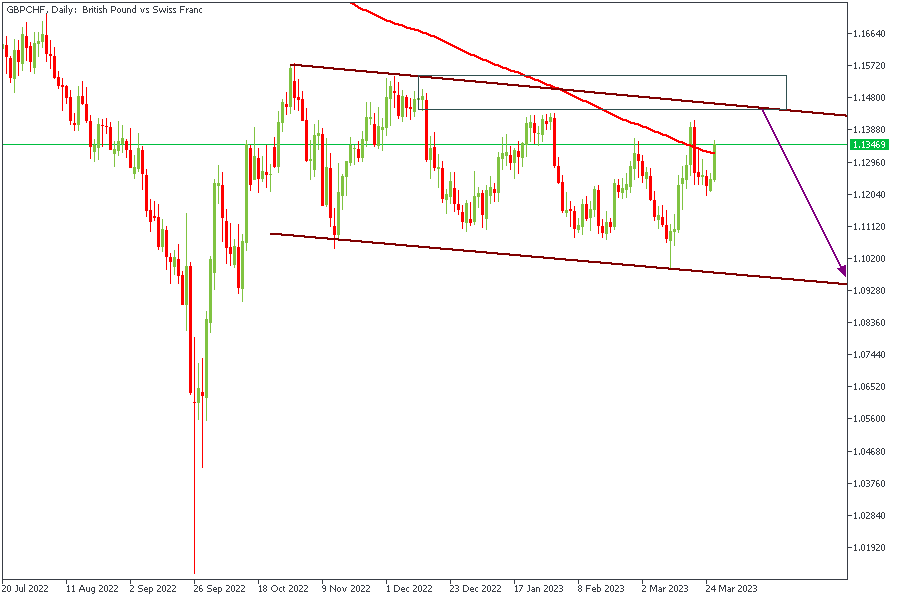
There'a hardly any need for a lengthy explanation of this GPBCHF chart. The major factors to consider here are; the resistance trendline, the rally-base-drop supply zone, the 200-Day MA, and the general overview of the market structure.
Analysts’ Expectations:
Direction: Bearish
Target: 1.11100
Invalidation: 1.15700
AUDUSD
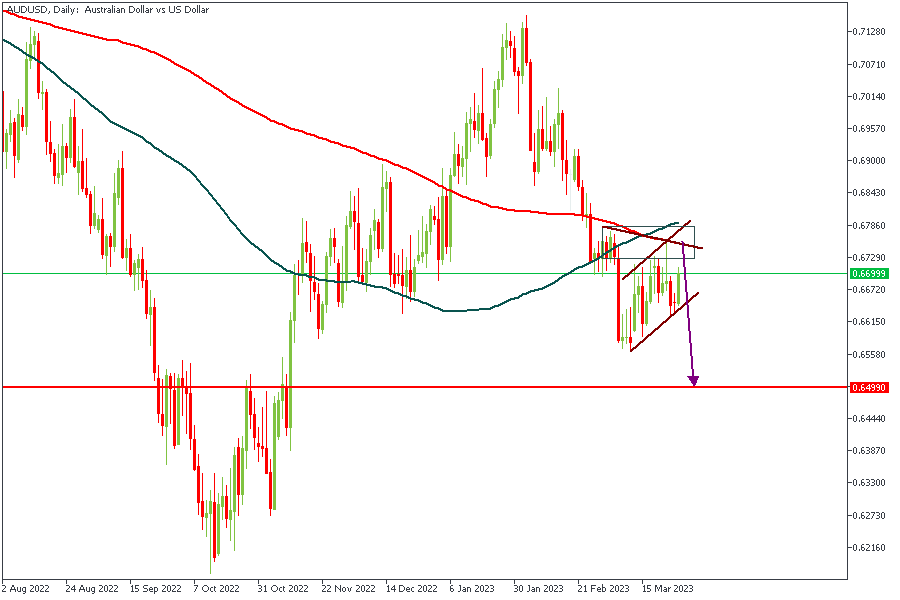
AUDUSD is another interesting idea I found. You see how the resistance trendline aligns with the rally-base-drop supply zone and the 200-Day MA? I see it too! And based on the general overview of the price action market structure, bearish seems the rational way to go.
Analysts’ Expectations:
Direction: Bearish
Target: 0.64330
Invalidation: 0.67860
CONCLUSION
The trading of CFDs comes at a risk. Thus, to succeed, you have to manage risks properly. To avoid costly mistakes while you look to trade these opportunities, be sure to do your due diligence and manage your risk appropriately.
You can access more of such trade ideas and prompt market updates on the telegram channel.