A trade idea for USD/MXN
Trade idea
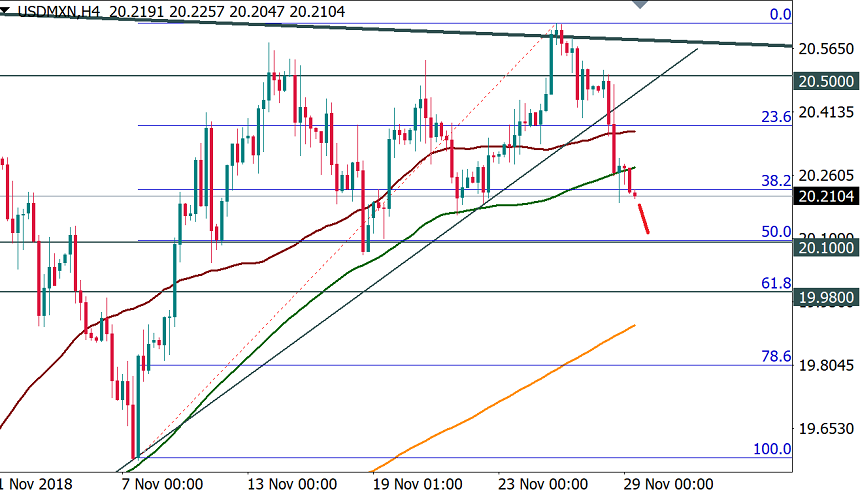
SELL at 20.20; TP1 20.10; TP2 19.98; SL 20.28
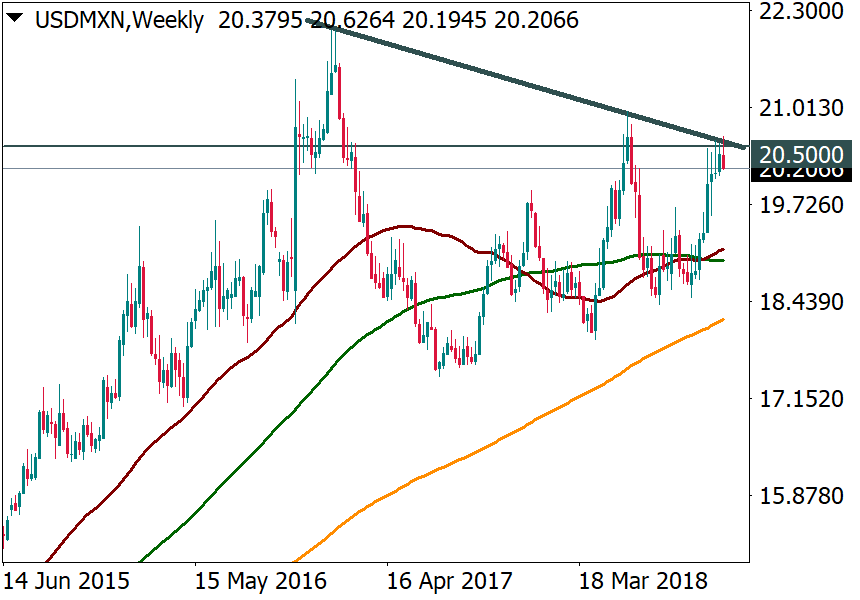
USD/MXN has met resistance at the line connecting 2017 and 2018 highs. On D1, it went far from the moving averages that are currently below the price chart and will likely correct down. The dynamics of the pair resembles a “Three drives” pattern and implies the further downside.

On H4, the prices crossed down support in form of moving averages. There was also a close below the 38.2% Fibo retracement. It's possible to make a bet on improvement in the market's risk sentiment and sell USD/MXN. Next Fibonacci levels may be the downside targets.
