Fundamental Analysis
Today, Wednesday, November 6, 2024, the S&P 500 reflects market optimism following Donald Trump's victory in the U.S. elections, known as the "Trump Trade." This phenomenon boosts risk assets like the S&P 500, which could reach new highs driven by expectations of pro-market and deregulation policies, viewed as favourable for economic growth and corporate expansion. The bullish trend is amplified by Republican control of Congress, which could facilitate the implementation of these policies.
In this context, the VIX volatility index, a key fear indicator in the market, has significantly dropped in pre-market trading to 15.44, a decrease of over 24%, according to the CBOE. This low volatility suggests a reduced perceived risk and increased investor confidence, which can be seen in a stable political environment that could benefit the stock market in the short to medium term. The drop in the VIX supports the bullish outlook for the S&P 500, as it reflects lower expectations of market turbulence.
Looking ahead, the S&P 500 could maintain a positive bias if Trump’s policies are realized and have a tangible impact on the economy. However, investors should remain vigilant for any geopolitical or economic events that could disrupt this apparent calm. The continuity of this trend will largely depend on the government’s initial steps in terms of fiscal and trade policy.
Technical Analysis
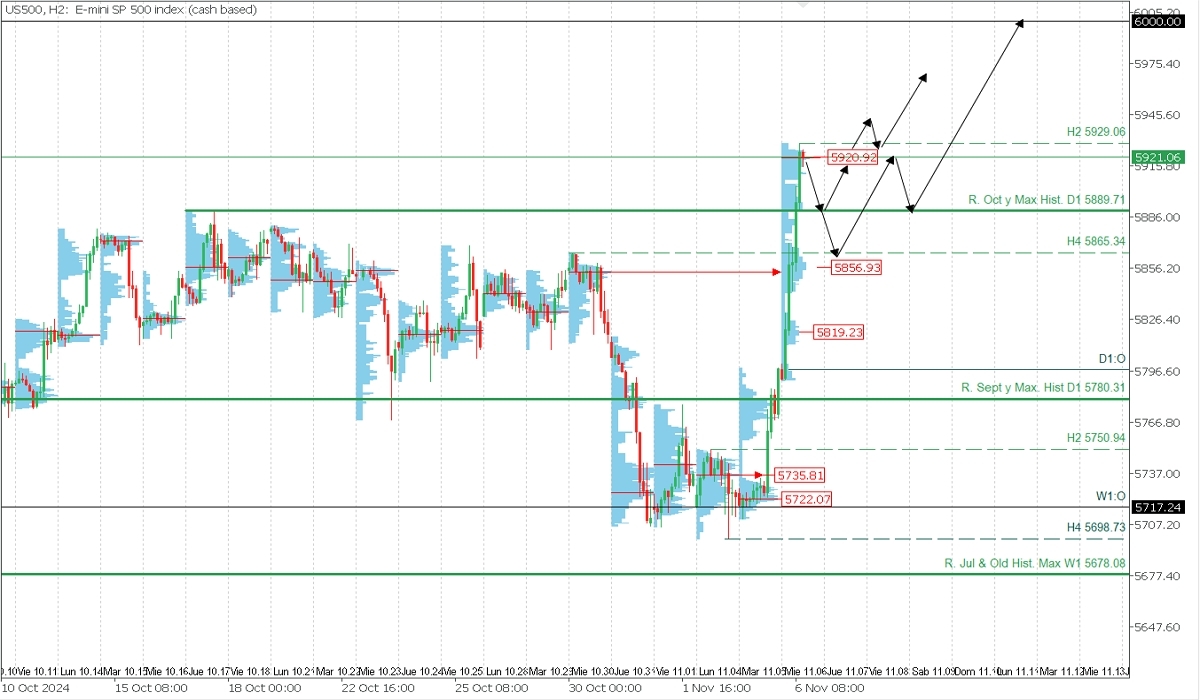
US500, H2

Supply Zones (Sell): 5920.92
Demand Zones (Buy): 5889.71, 5856.93, and 5819
The aggressive intraday downtrend, which represented a macro downward correction, concluded by establishing support at 5698.73. A rebound began on Tuesday, November 6, in anticipation of Trump’s victory, extending into the Asian session and European morning, establishing resistance at 5929.06, alongside a volume concentration around 5920.92. This rebound surpassed the average bullish range, so it’s not indicated here as it doesn’t add value today.
Suppose prices move below the indicated volume concentration. In that case, a correction is expected towards the broken October resistance and previous all-time high at 5889.71, or more broadly towards the next high-volume nodes around 5857 and 5819.23. Note that these are demand zones acting as volume-based supports.
The new price rally, whether anticipated with quotes above 5929 (without correction to the indicated demand zones) or following a necessary correction, aims to extend the bullish trend towards the 6000 mark by year-end, as outlined in the S&P 500 analysis published in our Telegram channel in March, linked here.
We will analyze the US100 and US30 indices in the Spanish trade ideas website and telegram channel.
Technical Summary
- Corrective Bearish Scenario: Intraday sales below 5920 (following the formation and confirmation of a PAR*) with TP at 5889.71, where buys can be resumed if an upward PAR* is observed, or more broadly at 5866 or 5855, and only if sales extend without forming an upward PAR* at previous levels, at 5820. Use an SL of 1% of your capital.
- Bullish Continuation Scenario: Purchases above 5889 (following the formation and confirmation of a PAR*) with TP at 5930, 5940, 5950, and medium-term at 6000. Use an SL of 1% of your capital with a low lot size to allow for movement.
Always wait for the formation and confirmation of an *Exhaustion/Reversal Pattern (PAR) in M5 as taught here https://t.me/spanishfbs/2258 before entering any operation in the key zones we indicate.
POC (Point of Control): The level or area where the highest volume concentration occurred. If there was a previous downward movement from this level, it is considered a sell zone and forms a resistance area. Conversely, if there was a prior upward movement, it is considered a buy zone, usually situated at lows, forming support zones.


