FBS turns 16

Unlock birthday rewards: from gadgets and dreams cars to VIP trips.Learn more
Open account
Open accountLog In
Open account

Apr 16, 2025

Strategy

VSA Analysis – What Signals Might It Provide?

MDP-8005_0_cover_1200x675_EN.png

If you are familiar with trading, you probably know the basics of fundamental and technical analysis. Generally speaking, fundamental analysis answers the question “Why does the market move?” and technical analysis tries to find out “When will the price movement occur?” However, you may not know a type of analysis, which combines both fundamental and technical practices. This approach is called VSA (volume spread analysis) and it is widely used by stock traders. Here we will explain how the VSA can be applied in forex trading.

What is the VSA?

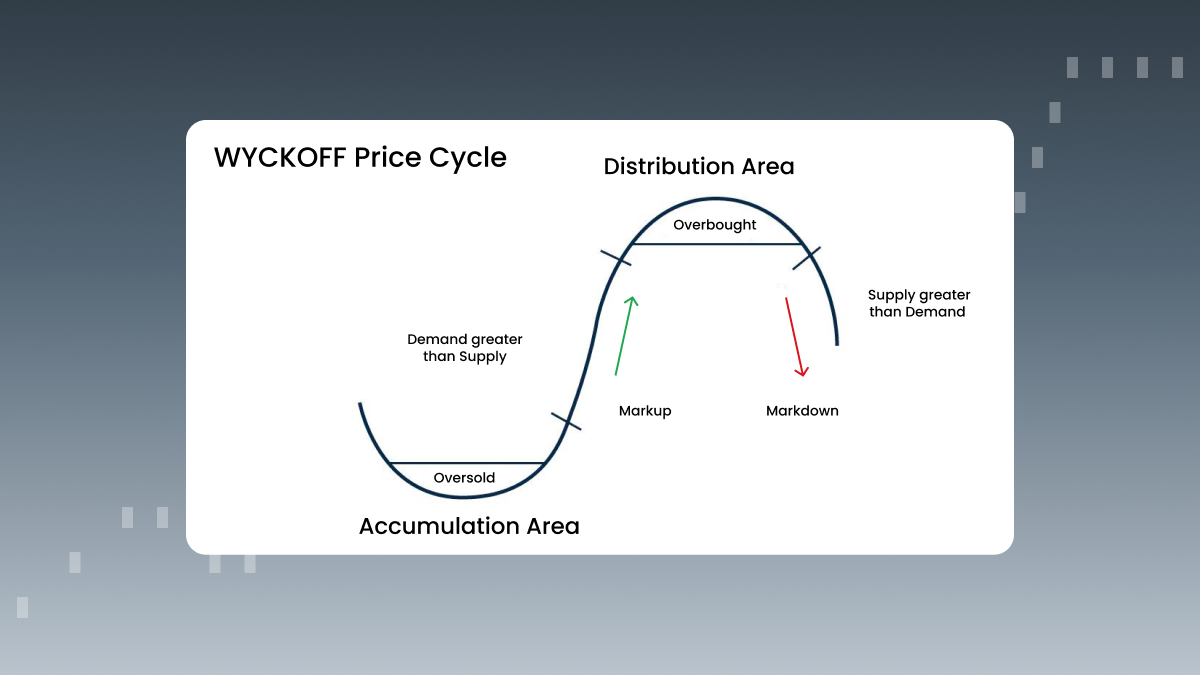
The VSA was invented by Richard D. Wyckoff, who started to trade stocks at the age of 15. At the end of the 20th century, Tom Williams improved on Wyckoff’s research and developed his own methodology. In his book called “Master the Markets,” he mentions the importance of price differences (spreads) as they pertain to volumes and closing prices.

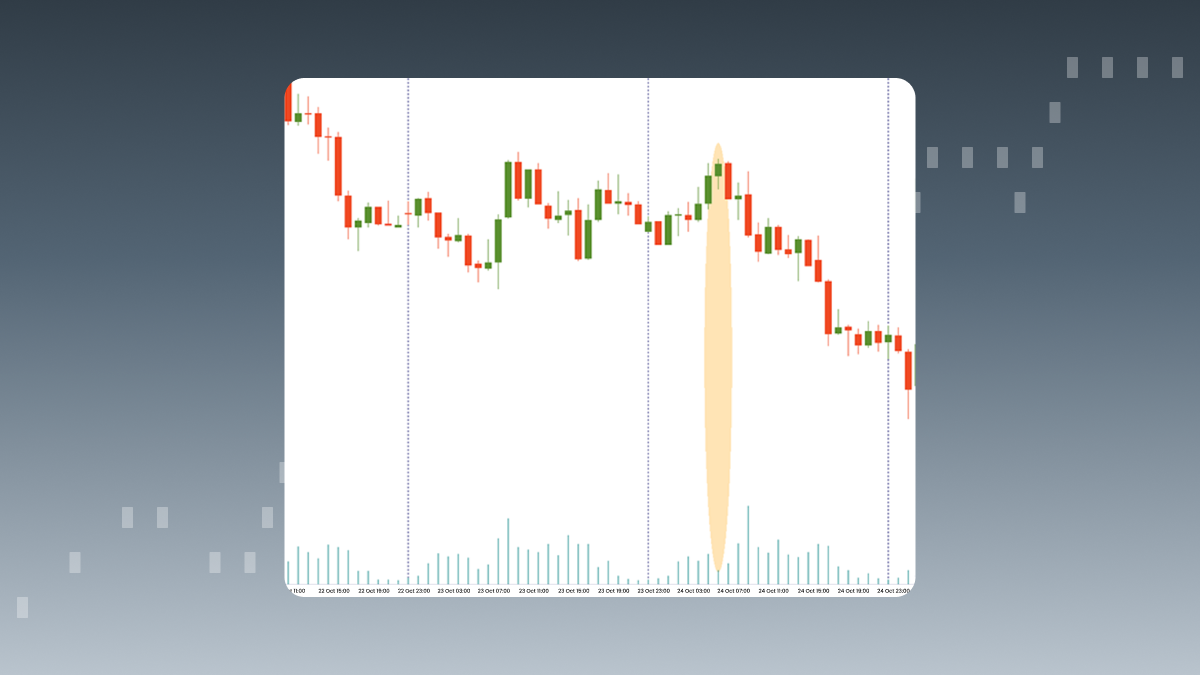
So what’s the VSA all about? Volume spread analysis is a type of analysis based on volumes and the candlestick spread. It tries to find out the differences between supply and demand created by the biggest players (professional traders, institutions, banks and market makers) on the forex market. If you know how to understand their actions, they may give you good signals to enter the market.

What makes up the VSA

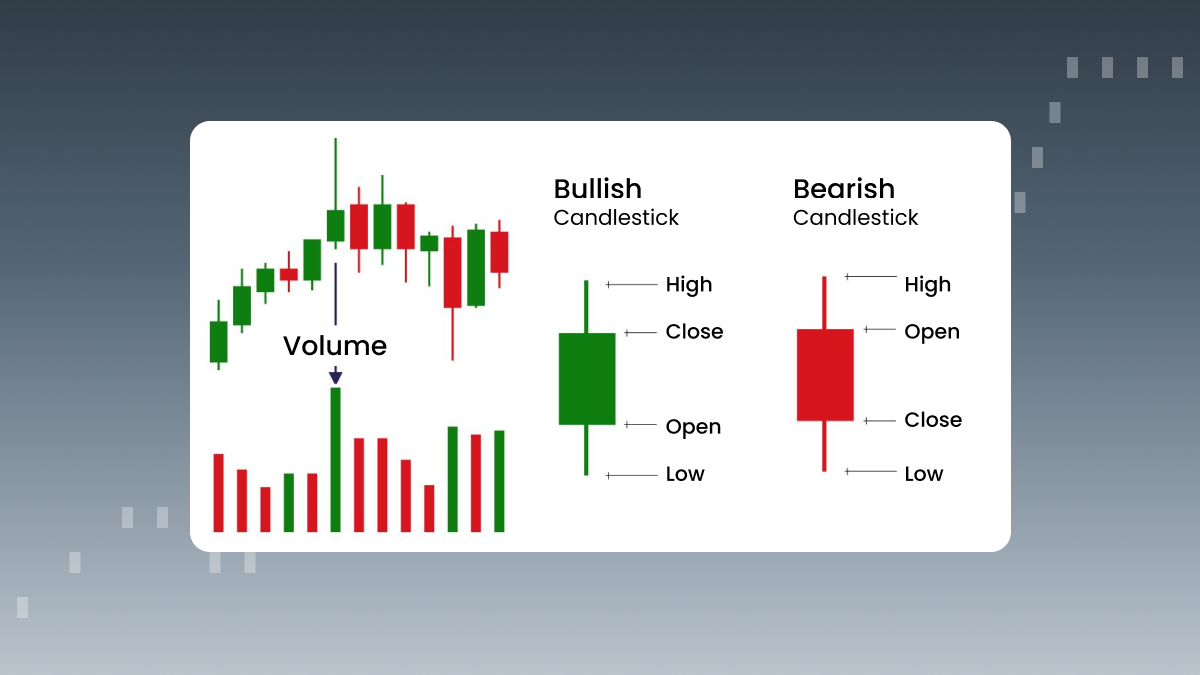
You need to determine three main variables to find out the balance between supply and demand:

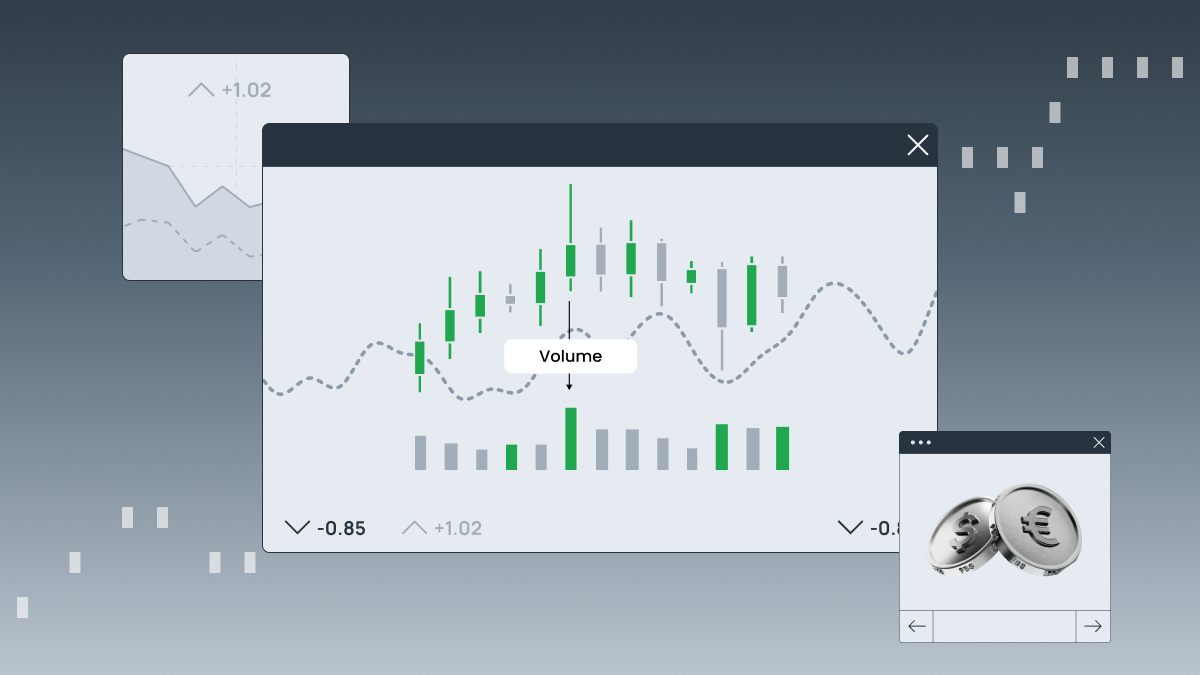
  • The quantity of volume on a price bar.

  • The high and low of the price bar (the range).

  • The closing price.

MDP-8005_1_1200x675_EN.png

Volumes are usually underestimated by new traders, but they are an important element of market analysis. The volume shows the transaction amounts while the price’s range demonstrates the movement in relation to the volume.

Based on these elements, traders can understand the current phase of the market. We can identify four of these stages, according to Mr. Wyckoff:

  • Accumulation (professional market members buy at wholesale prices during oversold conditions).

  • Mark-up (bullish movement).

  • Distribution (professional market members sell at retail prices during overbought conditions).

  • Mark-down (bearish movement).

MDP-8005_2_1200x675_EN.png

As we know, Richard D. Wyckoff used this analysis to trade stocks. But how can a forex trader apply it in practice? Let’s find out.

VSA for Forex traders

There are huge debates among traders on whether the VSA can be used on the forex market. The reason is that, unlike the stock market, the forex market is decentralized. As a result, actual volumes are not available. However, you may analyze the market by looking at the volume observed in each bar.

In MT4, you just need to right-click on the chart and press Volumes to see them. You can also press Ctrl+L on your keyboard.

Classic models of VSA analysis

There are a lot of different interpretations of the VSA, which makes it difficult for a beginner trader to understand. Here, we are going to introduce some of the most commonly used models of the VSA, according to Tom Williams, which may help you to trade with the professional players.

Signs of strength with bullish candlesticks

1st model – The bullish bar with a regular size. The price closed near the high. The volume is higher than the 15-20 day average, and, most importantly, higher than in the previous bar.

This model shows that the demand is increasing and the rise will continue.

MDP-8005_3_1200x675_EN.png

2nd model – Bullish/bearish candlestick (bullish gives a stronger signal). It updated the minimum. The size is bigger than usual. The closing price is placed close to the high. High volume.

This model signals a possible reversal.

MDP-8005_4_1200x675_EN.png

3rd model – Bullish/bearish candlestick (bullish gives a stronger signal). It updated the minimum. The size of the candlestick is big and the closing price is placed close to the high. Low volume.

It shows that professional players do not support the bearish market anymore.

MDP-8005_5_1200x675_EN.png

Signs of strength with bearish candlesticks

1st model – Small size of the candlestick. The closing price is placed close to the high. High volumes.

Major market players cover all the supply. Bears don’t have enough strength to overcome the opening price.

MDP-8005_6_1200x675_EN.png

2nd model – Bearish candlestick. It has a small size and a small volume. The closing price is placed close to the low.

This model shows the absence of sellers on the market.

MDP-8005_7_1200x675_EN.png

Signs of weakness

1st model – Bullish bar. It has a small size. The closing price is close to the low of the candlestick. High volumes. Occurs during an uptrend.

This is a sign of strong selling pressure.

MDP-8005_8_1200x675_EN.png

2nd model – Bullish bar, small size, low or extremely low volume. Occurs during a downtrend.

This model may signal the possible end of correction amid a downward trend.

MDP-8005_9_1200x675_EN.png

Tom Williams listed even more examples, but don’t follow them blindly. Check twice before making trading decisions.

Summary

The volume spread analysis helps traders understand market behavior based on volumes and analysis of candlesticks. However, you need to apply this analysis very carefully and take all the variables into account.

Share with friends:

Open an FBS account

By registering, you accept FBS Customer Agreement conditions and FBS Privacy Policy and assume all risks inherent with trading operations on the world financial markets.

FBS at social media

iconhover iconiconhover iconiconhover iconiconhover icon

Contact us

iconhover iconiconhover iconiconhover iconiconhover icon
store iconstore icon
Get on the
App Store
store iconstore icon
Get on the
Google Play

Trading

Company

About FBS

Legal documents

Company news

FC Leicester City

Help Center

Partnership programs

The website is operated by FBS Markets Inc.; Registration No. 000001317; FBS Markets Inc. is registered by the Financial Services Commission under the Securities Industry Act 2021, license number 000102/31. Office Address: 9725, Fabers Road Extension, Unit 1, Belize City, Belize.

FBS Markets Inc. does not offer financial services to residents of certain jurisdictions, including, but not limited to: the USA, the EU, the UK, Israel, the Islamic Republic of Iran, Myanmar.

Payment transactions are managed by HDC Technologies Ltd.; Registration No. HE 370778; Legal address: Arch. Makariou III & Vyronos, P. Lordos Center, Block B, Office 203, Limassol, Cyprus. Additional address: Office 267, Irene Court, Corner Rigenas and 28th October street, Agia Triada, 3035, Limassol, Cyprus.

Contact number: +357 22 010970; additional number: +501 611 0594.

For cooperation, please contact us via [email protected].

Risk Warning: Before you start trading, you should completely understand the risks involved with the currency market and trading on margin, and you should be aware of your level of experience.

Any copying, reproduction, republication, as well as on the Internet resources of any materials from this website is possible only upon written permission.

The information on this website does not constitute investment advice, a recommendation, or a solicitation to engage in any investment activity.