Introduction
The hammer candlestick is the most important tool a technical analyst and/or trader has at their disposal. It is a one-bar formation that is very effective in predicting probable reversals in the market. Among candlestick formations, the hammer is one of the most visible, and it gives critical insights into the psychology of participants that impact a given asset.
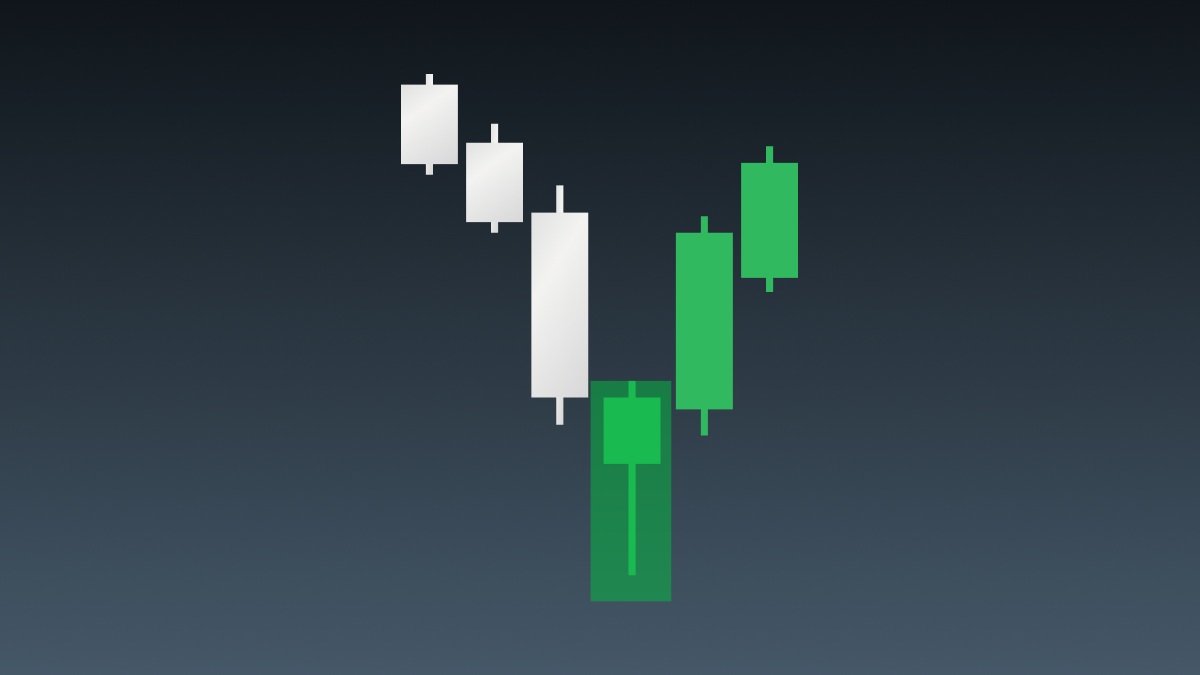
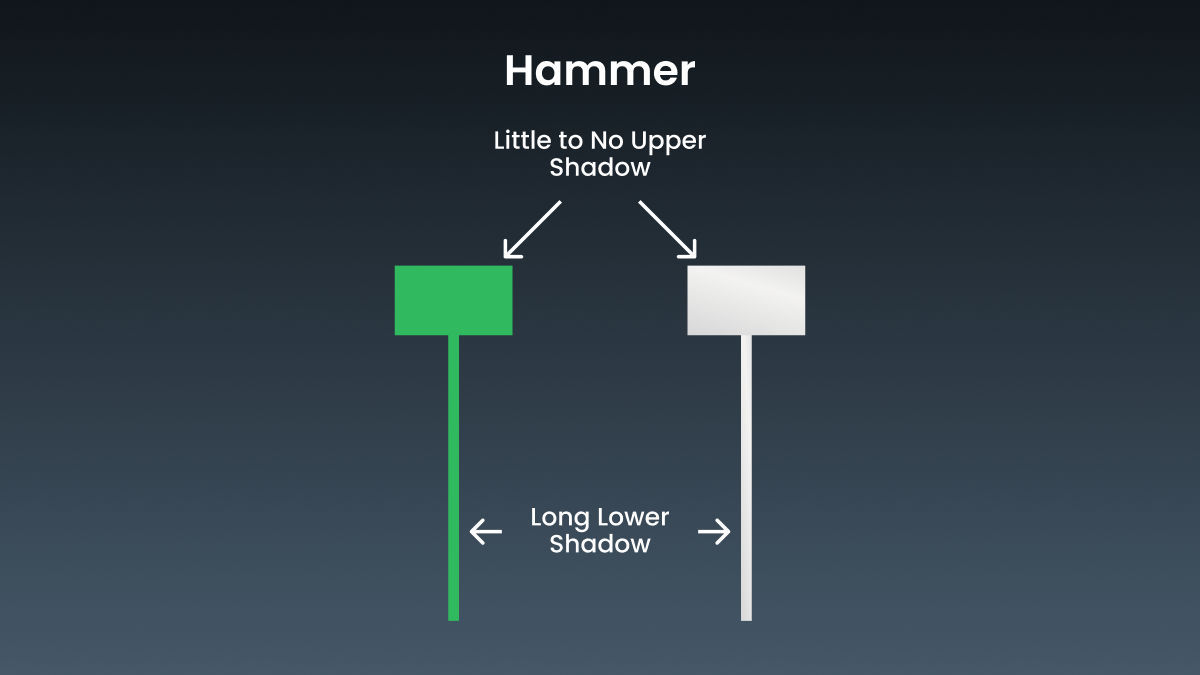
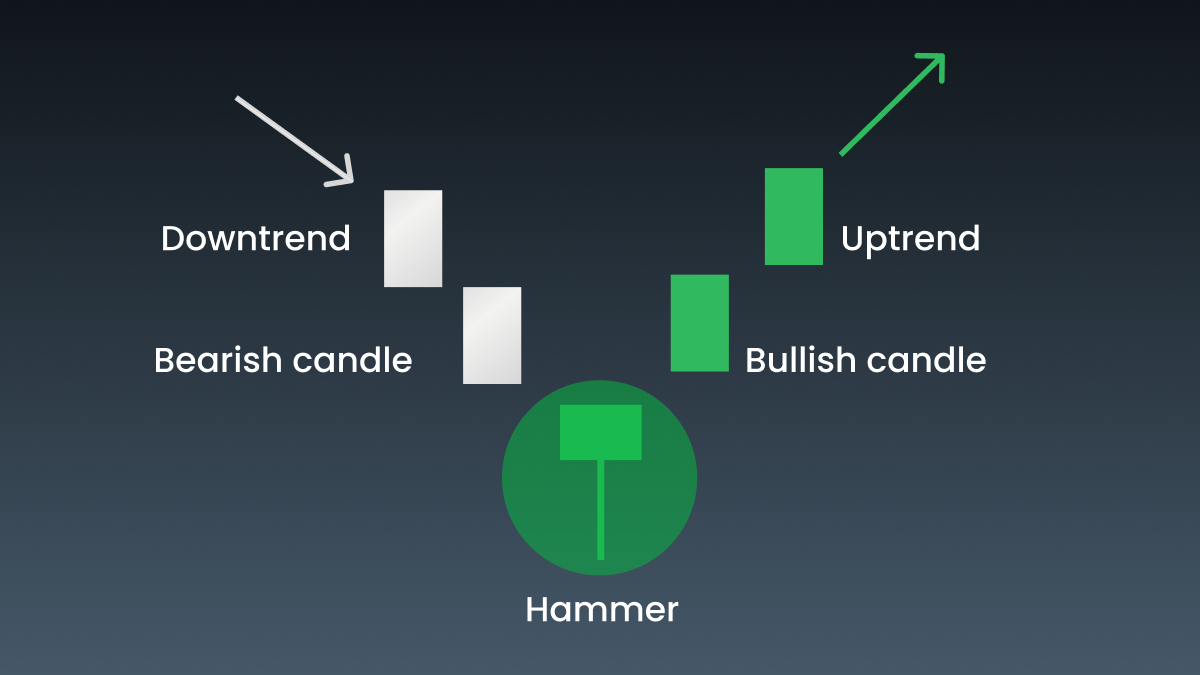
This candlestick appears during downtrends and signals that the trend might be over. The hammer candlestick has a small body close to the top of the candle, and a long lower shadow. That formation reflects that sellers had succeeded in pushing the price of an asset lower, but buyers took over and brought it back to near the opening price. Understanding the candlestick’s meaning, and applying it, can greatly improve your trading results.
What is a hammer candlestick?
The hammer is a one-candle price chart pattern that warns of a potential price reversal in the market. This type of candlestick usually forms after a prolonged downward striped run. The hammer indicates that strong selling pressure was exerted during the session, but buyers were able to drive up the price toward its opening level. On a chart, a lengthy lower shadow will culminate in a distinctive small-bodied candle at the top.
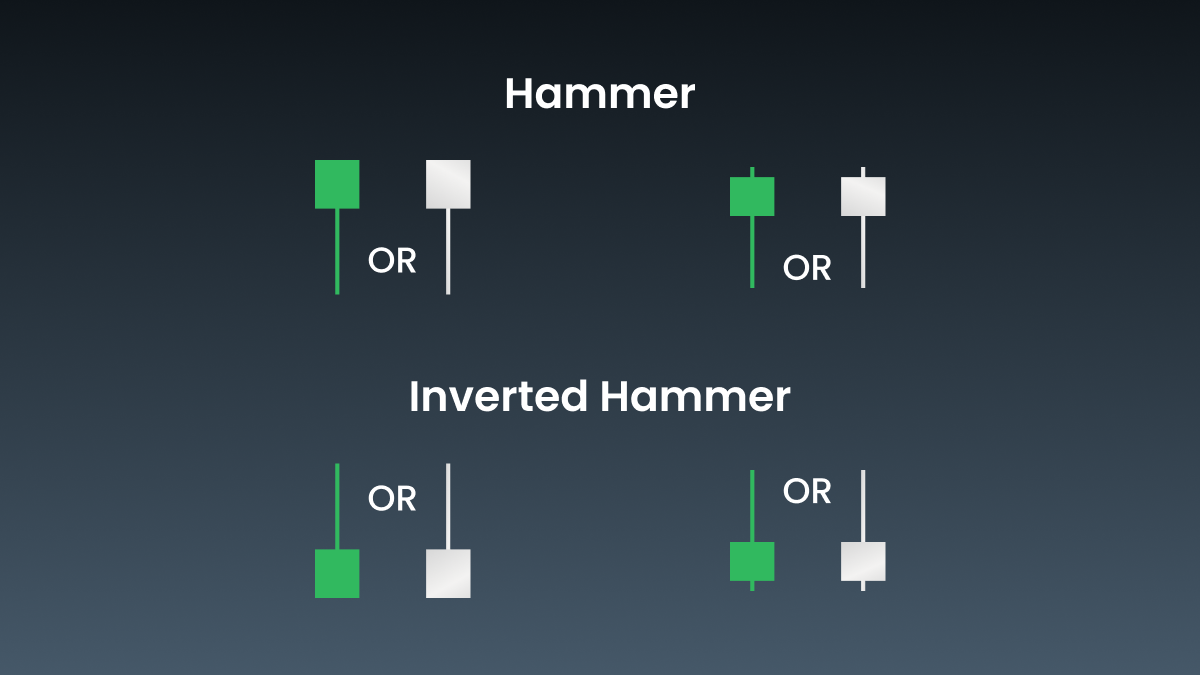
The hammer body can be bullish or bearish, green or white, or red or black, respectively. However, it is more effective as a reversal signal if it is bullish. This model reflects market psychology: it shows that although sellers had dragged the price down, buyers were able to gather enough energy to push it all the way back up, and therefore presumes a change of market sentiment from bearish to bullish.
Ready to catch the market at its turning point? Use the hammer candlestick to spot potential reversals before they unfold.
Key characteristics
Long lower shadow
One characteristic feature of the hammer candle is its very long lower shadow: it must be at least twice the length of the body. This long shadow indicates that the price dropped considerably during the session, but the emergence of strong buyer pressure returned the price to opening level. This pattern suggests that buyers have suppressed seller activity, and an end to the downtrend may be imminent, followed by new upward movement.
The inverted hammer
The inverted hammer candle looks like a hammer, but upside down: it features a long upper shadow instead of a lower one, while its body remains small and stays at the bottom of the trading range. This pattern indicates that buyers tried to push the price higher after a large drop, hit some resistance, and created a potential reversal signal that must be confirmed by the next move in prices. However, an inverted hammer works best for identifying bullish reversals at the end of a downtrend.
Interpreting the hammer candlestick
The hammer candle is a leading indicator of a market trend reversal, but to be effective, it must be contextualized by interpreting general market trends. A hammer candle signals to the trader that the market has tried to bring down the price of the asset within the currently open trading session, and has encountered heavy buying pressure that pushed the price back up. The interest buyers show near the lower boundary of a downtrend may anticipate an upcoming bullish sentiment change.
However, the hammer candle formation needs to be confirmed by other indicators or future price action. Many traders look for a confirmation candle that must close higher than the close of the hammer to generate buying interest. This confirmation greatly enhances the probability that the downtrend is over and a new uptrend may be about to start.
The context in which the hammer indicator appears is equally important. A single hammer candle may not be reliable on its own, but one that forms at key support levels, or in combination with other technical indicators, moving averages, or trend lines, amounts to a strong indicator. Understanding these other market attributes is essential for using the hammer candlestick pattern to make accurate trading decisions.
Register now to access sophisticated tools and insights that turn market indicators like the hammer candlestick into powerful trading decisions.
How investors use the hammer candlestick
The hammer candle forms the basis of various strategies that traders use to improve their results. Knowing how to apply those strategies can greatly improve the accuracy and profitability of transactions.
Strategies for entry
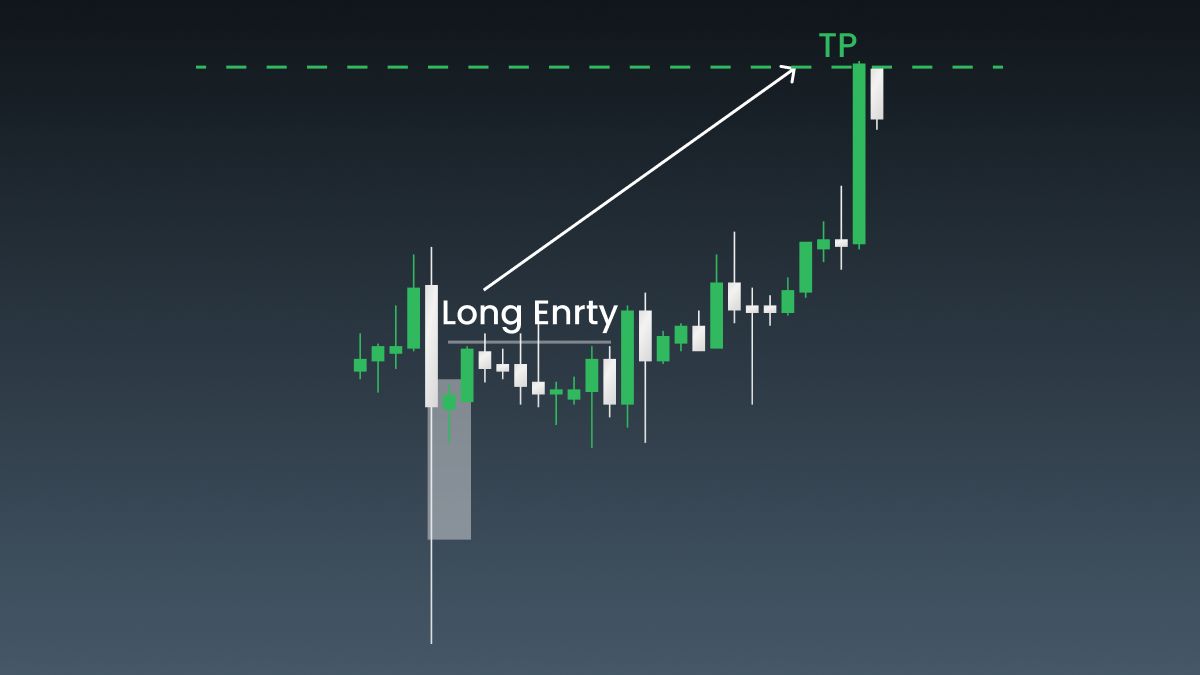
The hammer is defined as a potential entry point for opening a long position after a downtrend. Generally, the trader waits for the next candle to close above the high of the hammer before opening a trade. This confirmation shows that the buying pressure observed during the hammer period is continuing, increasing the possibility of a trend reversal.
For example, when a hammer candle forms on the daily chart of a stock whose price is falling, before opening an extended position, traders must confirm that the next day’s candle closes higher than the closing price of today’s hammer. This approach helps minimize false signals and ensures that the reversal will be backed by a steady buying impulse.
Setting stop-loss orders to manage risk
Effective risk management is critical when trading on the hammer candlestick pattern. Most traders set a stop-loss just below the bottom of the hammer shadow. This will minimize losses if the market turns against the deal. Having a stop-loss at this strategic point enables the trader to save capital, and provides opportunities for trading to develop.
For example, if EURUSD forms a hammer candle with at least one minimum price of 1.1000, then a good place for the stop-loss is 1.0950. At that level, the order will limit probable losses, but will allow for minor fluctuations of the market without unduly closing the position.
Examples of applying the hammer candlestick in trading scenarios
The hammer candle can be applicable across all markets and timeframes, from intraday charts to daily and weekly charts. The indicator becomes all the more crucial when the market gets highly volatile and price swings become prominent. For example, in a downtrend of the EURUSD forex pair, the formation of a hammer candle may signal a reversal, pushing traders who maintain proper risk management measures to establish long positions.
The hammer pattern often appears after earnings reports or critical news events. When the stock has declined due to pessimistic sentiment, but an earnings report comes in better than expected, a hammer candle may form. This could be a signal for reverse growth, which traders can use to open a long position and wait until the stock’s price recovers.
Real-world examples
Historical charts
The hammer candle has proved valuable to traders in many historical trading situations. One prominent example is the case of Apple Inc. (#APPLE). As seen in the graph below, after a steep downtrend in the wake of the financial crisis of 2008, in early 2009 a hammer candle formed on APPLE’s daily chart. This showed that some interest from buyers could be expected. That interest was confirmed by the next price change. Over the next few months, the robustness of the uptrend was strong enough to constitute a true reversal.
Another example comes from the commodity markets: early in 2016, crude oil prices plunged, hitting multiyear lows. A hammer candle formed on the weekly chart, which was an indication that much of the pressure from sellers was exhausted. The following weeks confirmed this reversal signal as crude oil prices began to recover again, demonstrating the usefulness of the hammer in predicting market lows.
Recent market events
The hammer candle is very informative in the light of recent market events. The financial markets experienced extreme swings due to the COVID-19 pandemic. In March 2020, as a result of its steep sell-off, the S&P 500 index formed a hammer candle on the daily chart. The pattern was typical of a possible bottoming, with the subsequent confirmation candles pointing at a shift in market sentiment. The index then went high, proving that a hammer can appear even in the most unpredictable market conditions.
The hammer candle also recently proved useful in the forex market. In 2023, the EURUSD currency pair was in a downtrend due to uncertain economic conditions in the eurozone. A hammer candle indicating that the trend may reverse appeared on the daily chart. Traders who recognized this pattern and acted on the confirmation candle saw the pair grow.
Summary
One of the most valuable candlestick patterns traders and investors have at their command is the hammer. It generally constitutes a reliable signal that there might be a market reversal from the trend. The formation is marked with a small body and a long lower shadow, indicating that buying is overpowering selling pressure, reflecting a shift in market sentiment. Thus, this pattern used for trading strategies enables investors to decide on the best timing for their entry and exit positions to maximize returns.
The most effective way to use the hammer candle is to confirm it with the next price action or other technical indicators, always maintaining proper risk management through stop orders. Understanding the market generally and contextualizing the hammer model within a mosaic of other analytical tools will greatly help a trader make more informed strategic decisions.
FAQ
What is the hammer candlestick used for?
The hammer candlestick is used in technical analysis to predict potential trend reversals in the stock market. It typically appears at the bottom of a downtrend and is characterized by a small real body and a long lower shadow, indicating that despite significant selling pressure, buyers have managed to push the price back up. This pattern suggests that the market may be finding a bottom, and a bullish reversal could be on the horizon. The hammer candlestick pattern and its variations, like the inverted hammer candlestick, are valuable tools for traders looking to identify favorable entry points for long positions.
Is the hammer candlestick a buy or sell?
The hammer candlestick is generally considered a bullish signal and is more often associated with a buy rather than a sell. It signifies a potential reversal from a bearish to a bullish trend. However, traders typically seek confirmation from the subsequent candle, which should close above the hammer’s close to validate the bullish reversal. While a green hammer candle is often seen as a stronger signal, even a red hammer candlestick can indicate a buying opportunity if subsequent candles confirm the reversal.
How accurate is the hammer candle?
The accuracy of the hammer candle in predicting market reversals is not absolute, but it is relatively high when used with other technical indicators and patterns. Historical data analysis shows that while the hammer candlestick pattern often indicates a bullish reversal, its success rate improves significantly when confirmed by subsequent price action and other indicators. Thus, while a hammer candle can be a reliable indicator, it should not be relied upon alone as a basis for trading decisions.
What is the psychology behind the hammer candlestick?
The psychology behind the hammer candlestick reflects a shift in market sentiment from bearish to bullish. During the formation of the hammer candle, sellers initially push the price down, creating a long lower shadow. However, buyers step in and drive the price back up, closing near or above the opening price. This price action suggests that the market rejects lower prices and that buyer interest is strong enough to reverse the downtrend. The inverted (or upside-down) hammer candle conversely indicates that buyers are starting to gain control after a period of selling pressure, signaling a potential bullish reversal.