
In trading, we can rely on a bunch of different entry signals.
2023-04-03 • Updated
This article describes the strategy known as ‘Method Jarroo’. It is based on the concept of price action but with some unique features. Are you interested? Then, let’s explore this strategy!
The levels above the price will be called resistance levels, below – support levels.
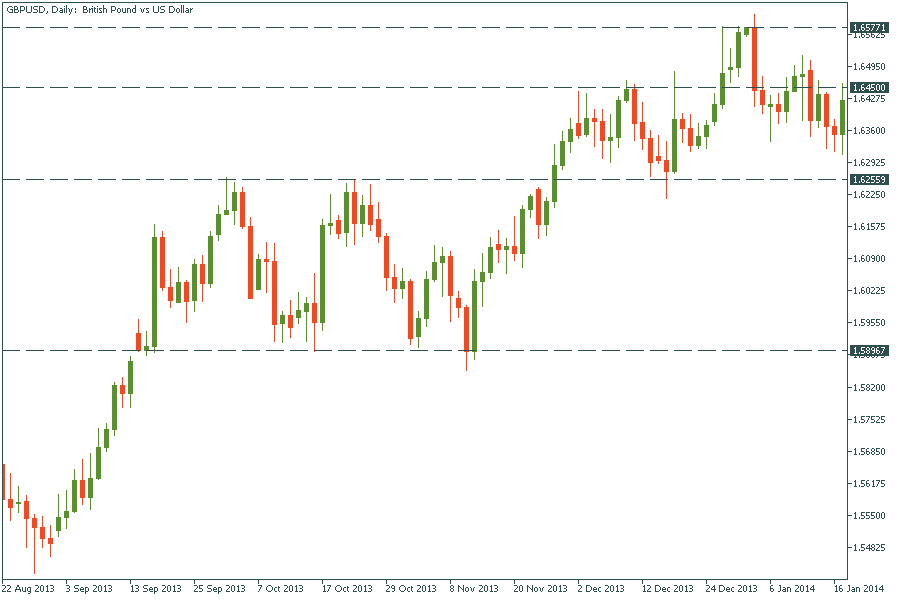
If you forgot or don’t know what pending orders are, read our article with a clear explanation called “Traders’ secret weapon: pending orders”.
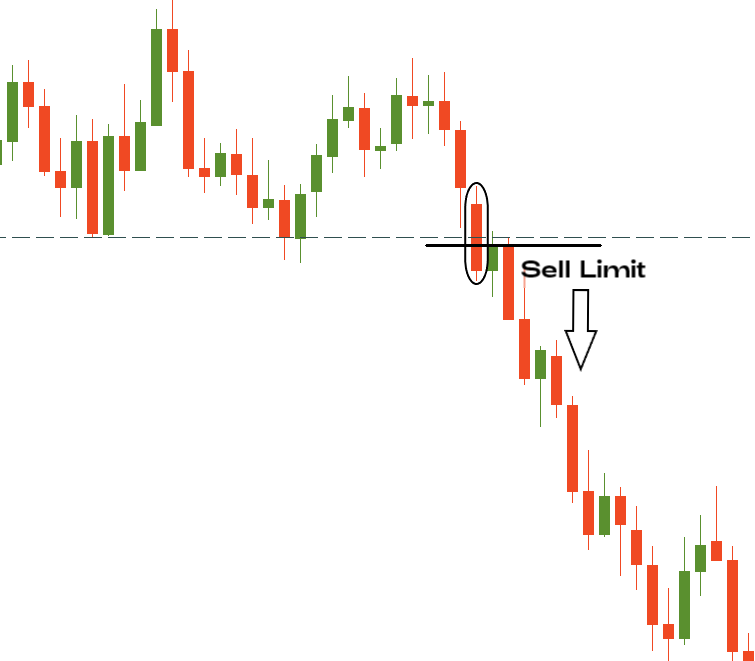
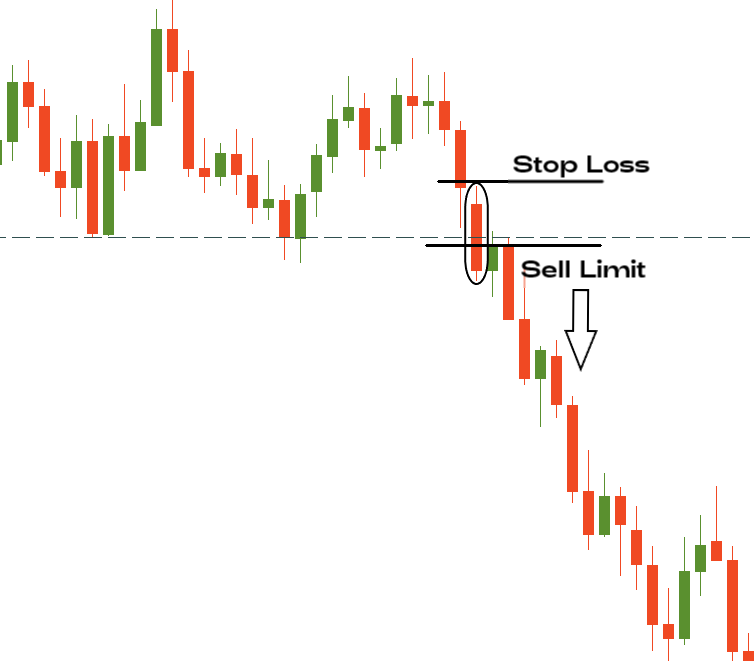
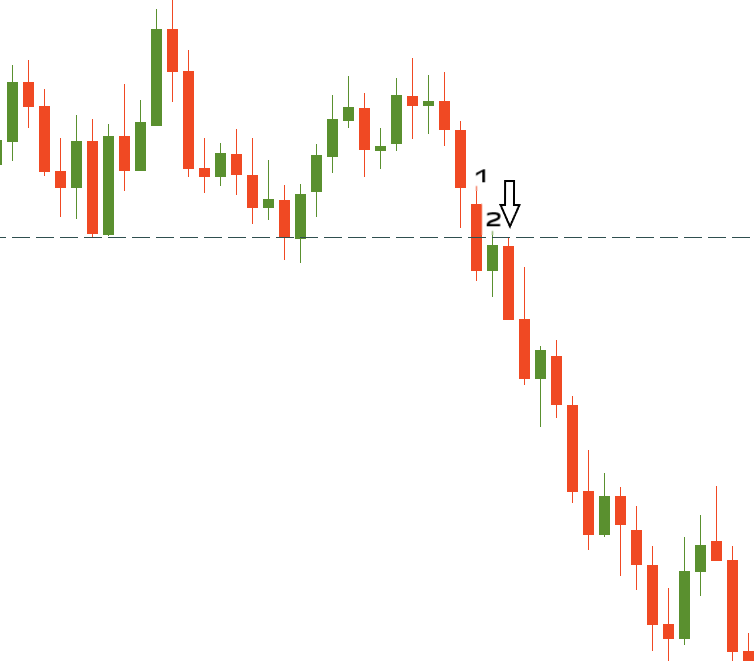
If the candle is too large, you can place the Stop Loss just slightly below resistance / above the support level.
To place Take Profit, you’ll need to find the nearest levels of support and resistance as well. It should be greater than the Stop Loss by 2 or 3 times. For example, if you put the Stop Loss 30 pips higher than the current price level, you should consider placing Take Profit 90 pips lower than the current price.
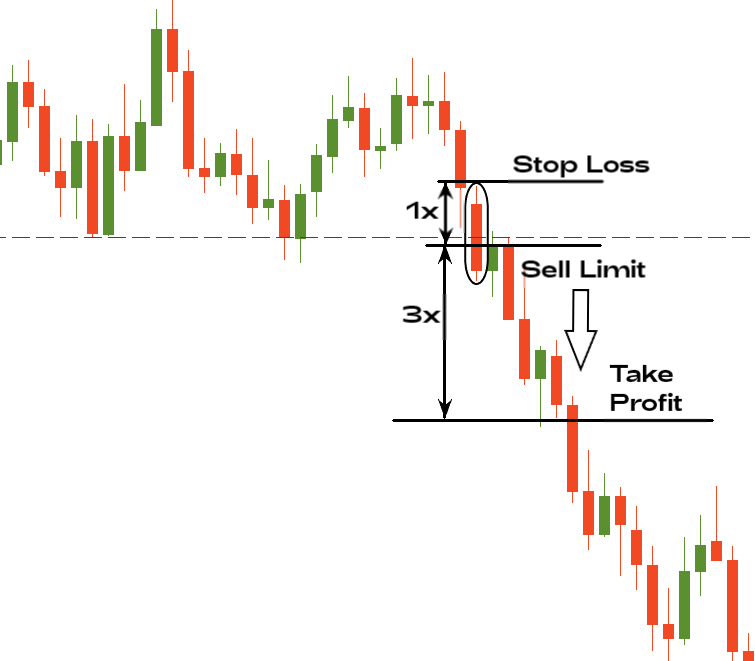
According to risk management rules, a trader should use no more than 1-2% of the deposit to open one order. Besides, there is a more conservative way to use this strategy. After the signal candle appears and breaks the support/resistance level, a trader shouldn’t open the pending order as written above. Instead, he/she should wait for the next candlestick to occur in the chart. Then, if this next candlestick doesn’t break the critical level back, a trader should place a pending order.
Great! You’ve just learned a pretty hard strategy! If you want to try it, use the Demo account!

In trading, we can rely on a bunch of different entry signals.

A triangle chart pattern is a consolidation pattern that involves an asset price moving within a gradually narrowing range.

Trading has several levels of complexity, starting from the easiest, like buying and selling random assets, to a more comprehensive one, with deliberate risk management, timing, and objectives.
If you are 18+ years old, you can join FBS and begin your FX journey. To trade, you need a brokerage account and sufficient knowledge on how assets behave in the financial markets. Start with studying the basics with our free educational materials and creating an FBS account. You may want to test the environment with virtual money with a Demo account. Once you are ready, enter the real market and trade to succeed.
Click the 'Open account' button on our website and proceed to the Trader Area. Before you can start trading, pass a profile verification. Confirm your email and phone number, get your ID verified. This procedure guarantees the safety of your funds and identity. Once you are done with all the checks, go to the preferred trading platform, and start trading.
The procedure is very straightforward. Go to the Withdrawal page on the website or the Finances section of the FBS Trader Area and access Withdrawal. You can get the earned money via the same payment system that you used for depositing. In case you funded the account via various methods, withdraw your profit via the same methods in the ratio according to the deposited sums.
FBS maintains a record of your data to run this website. By pressing the “Accept” button, you agree to our Privacy policy.
Your request is accepted.
A manager will call you shortly.
Next callback request for this phone number
will be available in
If you have an urgent issue please contact us via
Live chat
Internal error. Please try again later
Don’t waste your time – keep track of how NFP affects the US dollar and profit!
