This article introduces you to a trading strategy that doesn’t require volumes, technical indicators, and price patterns. All you need to do is to be attentive to the price action. Welcome to the Imbalance tutorial.
2023-03-16 • Updated
As we know, strong trend movements are important on the market. We present you a trending strategy that will allow you to identify the very beginning of a solid incipient trend and open a deal.
Instruments: any
Indicators: MACD (12,26,9), Parabolic SAR (0.02; 0.2) and SMA (period 10) with the default settings
Timeframe: >H1
Risk management rules: Fixed trade volume with 0.1 lot.
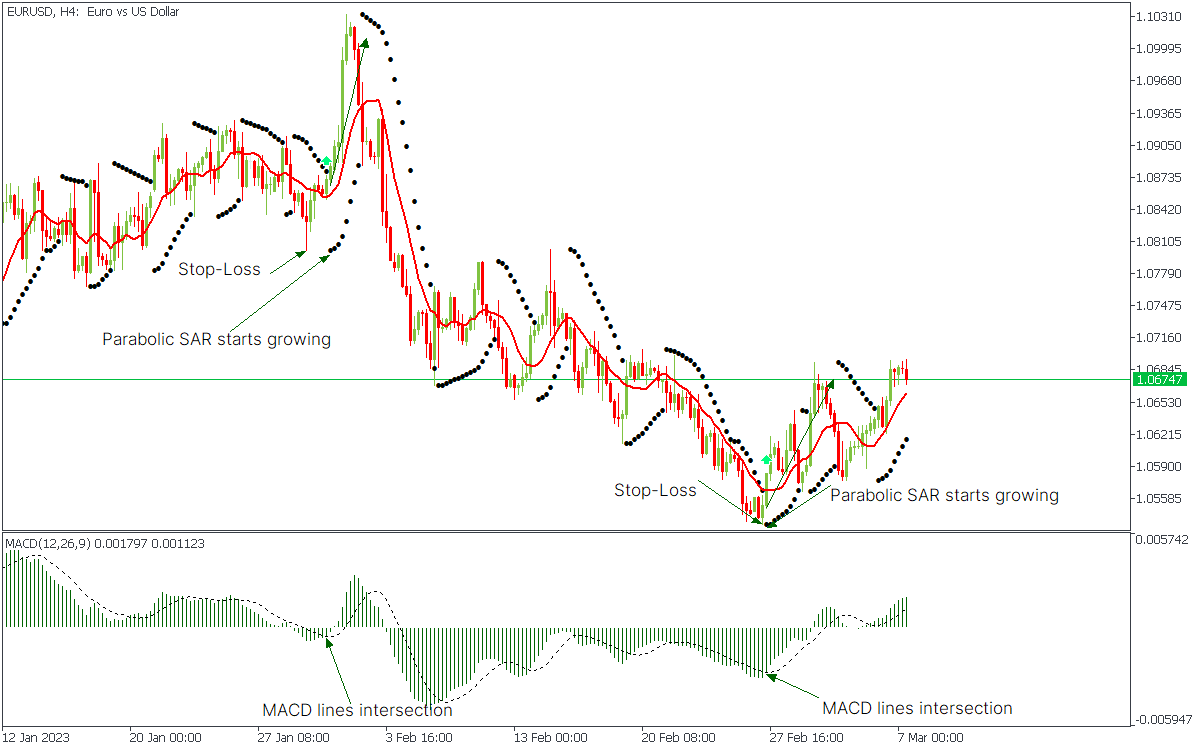
It is recommended to use a Stop Loss at the level of the nearest local minimum before receiving the signal.

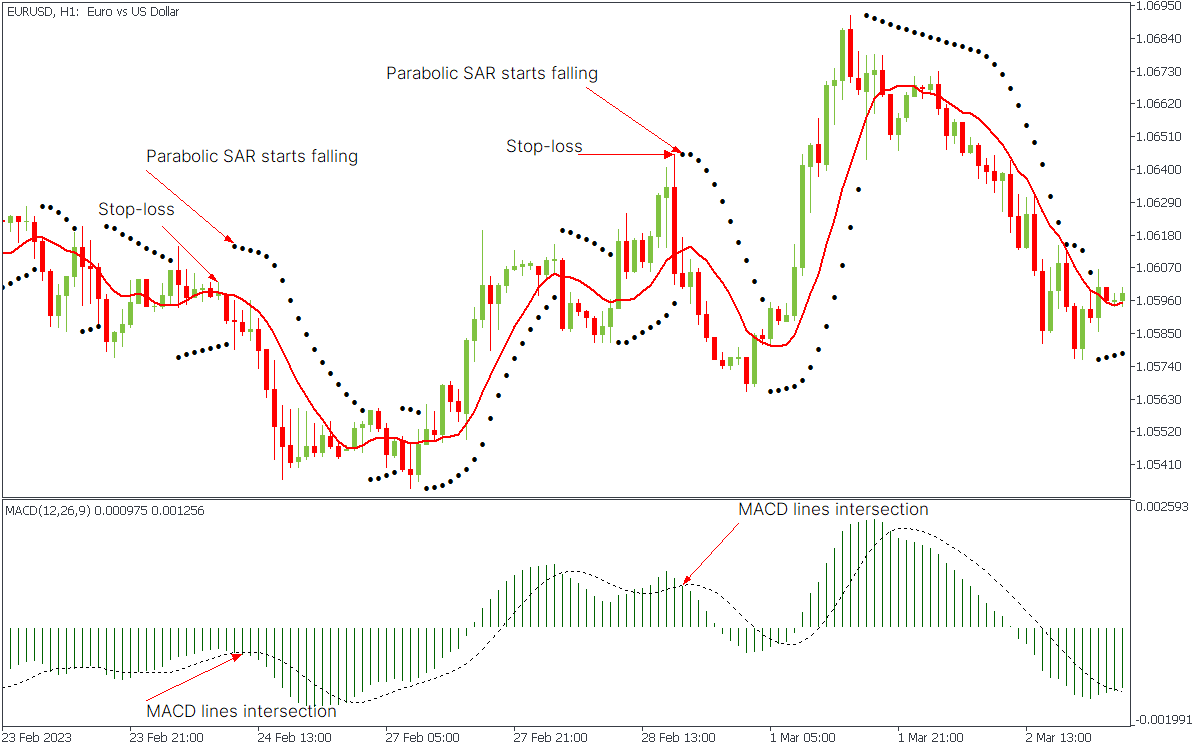
It is recommended to use a Stop Loss at the level of the nearest local maximum before receiving the signal.

When searching for signals, it is important to pay attention to how the MACD lines are crossed. The sharper the crossing (the more substantial the "angle of attack"), the greater the chance of a successful signal. Typically, the angle of attack depends on how far the MACD lines deviate from each other before they cross.
The MACD+Parabolic indicators can be combined with other types of technical analysis. For example, with chart analysis and support/resistance levels. If the buy signal appears when the price tests support levels, the probability of a successful transaction increases. The same is true for the sell signal at resistance levels.
Trade with FBS using MACD and Parabolic and become a true professional!

This article introduces you to a trading strategy that doesn’t require volumes, technical indicators, and price patterns. All you need to do is to be attentive to the price action. Welcome to the Imbalance tutorial.

The DeMarker Indicator was invented and described by Thomas DeMark.

This article explores the MACD + RSI trading strategy and how it can be effectively employed to identify trade opportunities in the forex market.
If you are 18+ years old, you can join FBS and begin your FX journey. To trade, you need a brokerage account and sufficient knowledge on how assets behave in the financial markets. Start with studying the basics with our free educational materials and creating an FBS account. You may want to test the environment with virtual money with a Demo account. Once you are ready, enter the real market and trade to succeed.
Click the 'Open account' button on our website and proceed to the Trader Area. Before you can start trading, pass a profile verification. Confirm your email and phone number, get your ID verified. This procedure guarantees the safety of your funds and identity. Once you are done with all the checks, go to the preferred trading platform, and start trading.
The procedure is very straightforward. Go to the Withdrawal page on the website or the Finances section of the FBS Trader Area and access Withdrawal. You can get the earned money via the same payment system that you used for depositing. In case you funded the account via various methods, withdraw your profit via the same methods in the ratio according to the deposited sums.
FBS maintains a record of your data to run this website. By pressing the “Accept” button, you agree to our Privacy policy.
Your request is accepted.
A manager will call you shortly.
Next callback request for this phone number
will be available in
If you have an urgent issue please contact us via
Live chat
Internal error. Please try again later
Don’t waste your time – keep track of how NFP affects the US dollar and profit!
