
How to Trade Three Black Crows Candlestick Pattern
In trading, we can rely on a bunch of different entry signals.
2023-01-24 • Updated
General
In line with other well-known indicators, Bill Williams developed the Fractals indicator, which is based on the notion of a fractal he introduced to the forex knowledge base. There may be various ways to apply it. Generally, it is used to identify stronger trend potential in the market and often market reversal points. Like any other indicator, there are advantages and disadvantages of it, and we will address all of that below so you may effectively use it in your daily activities.
Finding
There are two ways to find fractals on the chart.
The first one – manual. You will just have to read the following information and be able to identify each fractal on a chart according to the sequence of candlesticks required to form a fractal.
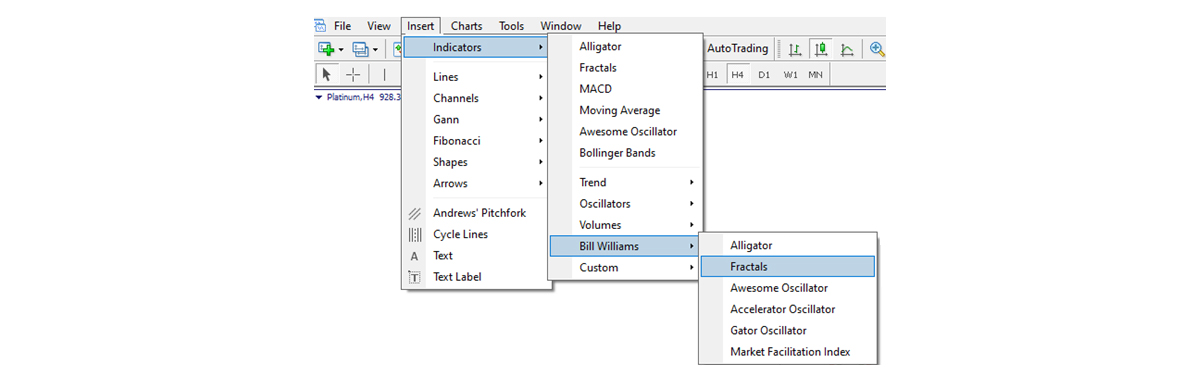
The second one – clicking to reflect the Fractals Indicator on the chart. You will see the way to do that in the next image.
Composition
A fractal is a sequence of five complete candlesticks. It may be either bullish (down) or bearish (up).
You may see a small complication in the naming compared to the usual methodology: bullish normally means rising and bearish usually refers to falling in the forex world. While here, you see that a bullish fractal is also a down fractal and a bearish fractal is an up fractal. No need to worry, it is quite straightforward as you will see, let us have a look.
To separate a fractal from the continuous sequence of candlesticks on a chart, we have to find an arrow-like formation of five candlesticks (although it does not always have to be clearly resembling an arrow). Once we separated the five candlesticks, we look at the middle one (the third one, which is in the center). So now, we have a central candlestick with two wings: two candlesticks on the left and two on the right. According to the relative position of central candlesticks tip, we can identify our fractal as either up (bearish) or down (bullish).
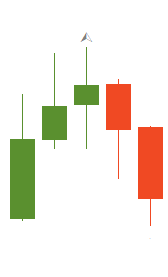
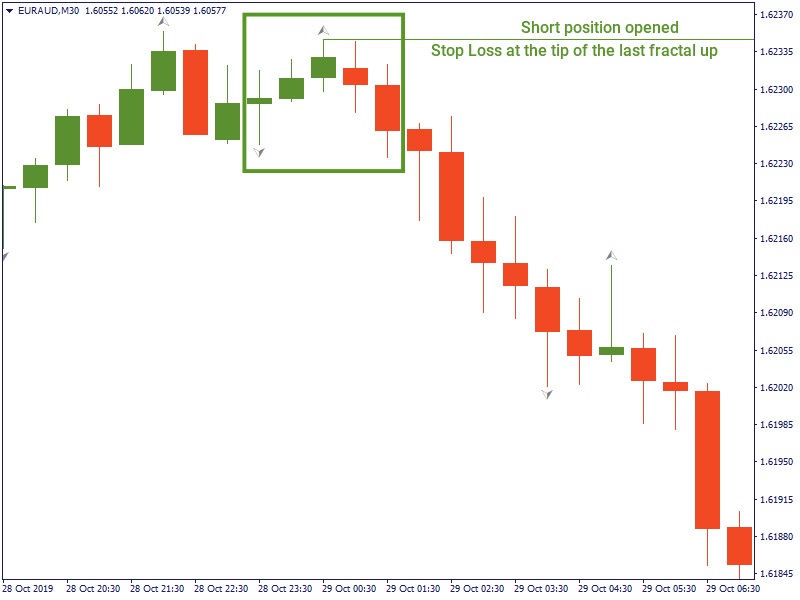
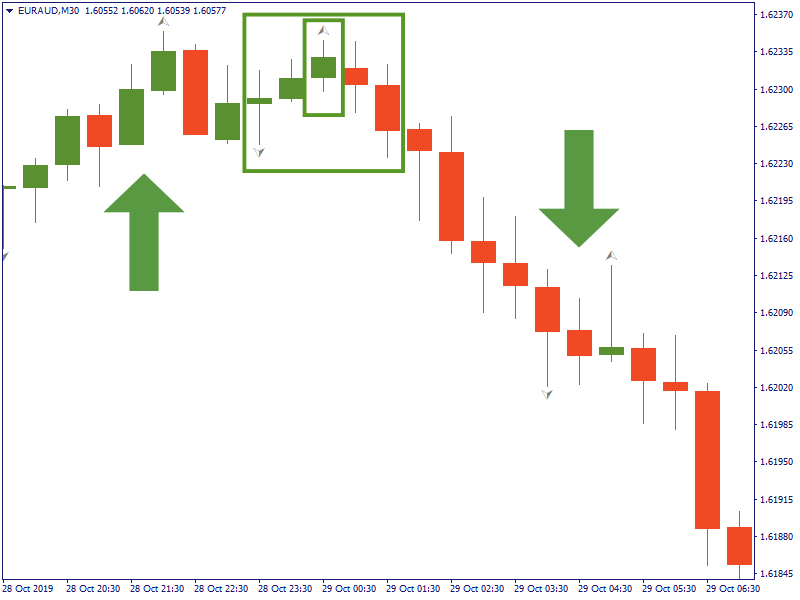
In a bearish fractal, the central candlestick has the highest high, while those on the sides have lower highs. The fractal as a whole point up, but it precedes a downward movement. That’s the reason it is called bearish. See the image below.
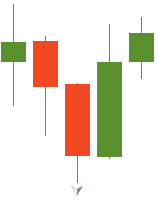
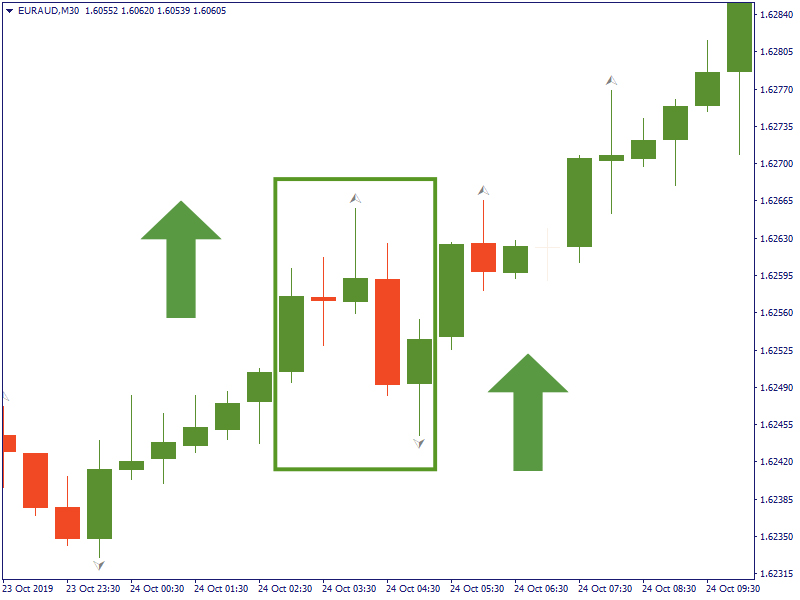
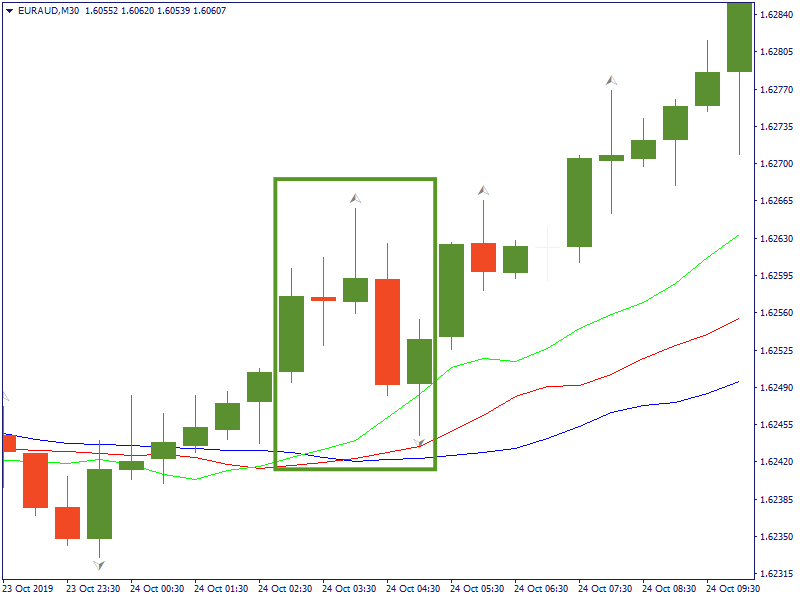
In a bullish fractal, the central candlestick has the lowest low, with the higher lows on the left and on the right, like it is shown in the next image. As it often comes before the market reversal to the upward direction, it earned its name as a bullish fractal.
Now as we know how to find fractals on a chart, let us examine some practical applications for this tool.
Ways to use
Ways to combine
It is always better to have several indicators in use complementing each other rather than relying on just one. The Fractals indicator is not an exclusion. It may be as reliable or unreliable as any other tool, that’s why we will have a look at how you may combine it with other methods.
Pay attention
There are several adjustments that a trader needs to make when using fractals.
Firstly, a Fractals indicator is a lagging indicator. Before a fractal finishes its formation or is seen to be discarded a market may have already moved significantly. So, it’s important to get additional confirmation from other indicators.
Secondly, there may be a lot of fractals on the chart. This may create confusion. That is why you need to choose your trading strategy first or decide which fractal to trade on. Otherwise, trying the chase trades on each fractal may lead to losses.
And finally, fractals are more reliable when used on higher timeframes. However, there will be a smaller number of fractals formed on such a timeframe. Vice versa, on a lower timeframe there will be many single fractals formed but they have lower reliability.
Conclusion
Bill Williams Fractals is an interesting indicator with certain reasoning behind it and is among the basic ones which a lot of traders use it in their trading routine. It may be a very good element in the system of trading tools to identify possible market moves and make informed trade decisions. Use it carefully, trade with the trend, and you will be the safe side of the market.

In trading, we can rely on a bunch of different entry signals.

A triangle chart pattern is a consolidation pattern that involves an asset price moving within a gradually narrowing range.

Trading has several levels of complexity, starting from the easiest, like buying and selling random assets, to a more comprehensive one, with deliberate risk management, timing, and objectives.
If you are 18+ years old, you can join FBS and begin your FX journey. To trade, you need a brokerage account and sufficient knowledge on how assets behave in the financial markets. Start with studying the basics with our free educational materials and creating an FBS account. You may want to test the environment with virtual money with a Demo account. Once you are ready, enter the real market and trade to succeed.
Click the 'Open account' button on our website and proceed to the Trader Area. Before you can start trading, pass a profile verification. Confirm your email and phone number, get your ID verified. This procedure guarantees the safety of your funds and identity. Once you are done with all the checks, go to the preferred trading platform, and start trading.
The procedure is very straightforward. Go to the Withdrawal page on the website or the Finances section of the FBS Trader Area and access Withdrawal. You can get the earned money via the same payment system that you used for depositing. In case you funded the account via various methods, withdraw your profit via the same methods in the ratio according to the deposited sums.
FBS maintains a record of your data to run this website. By pressing the “Accept” button, you agree to our Privacy policy.
Your request is accepted.
A manager will call you shortly.
Next callback request for this phone number
will be available in
If you have an urgent issue please contact us via
Live chat
Internal error. Please try again later
Don’t waste your time – keep track of how NFP affects the US dollar and profit!
|


