EUR/USD 4H chart EUR/USD surged after Powell’s speech on Friday…
2019-11-11 • Updated
Recommendation:
SELL 1.2245
SL 1.2300
TP1 1.2095 TP2 1.2050 TP3 1.1965
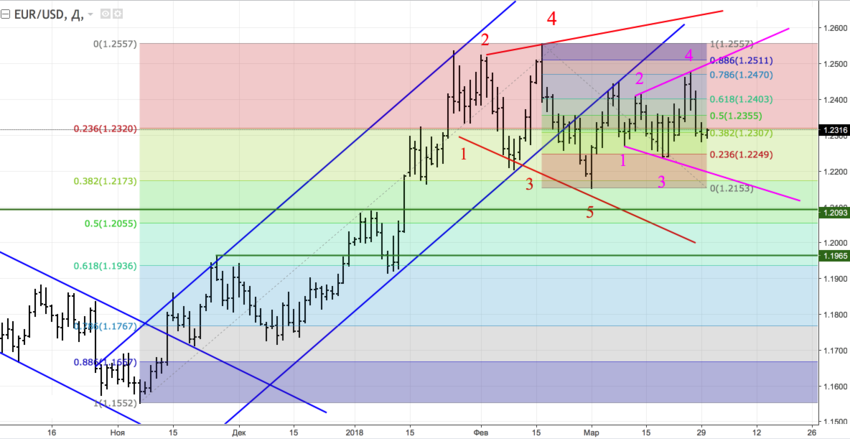
On the daily chart, EUR/USD may form a unique chart pattern: a wedge inside a wedge. Point 5 of the junior pattern “Widening wedge” corresponds to 23.6% of the senior pattern’s wave 4-5. This creates a powerful entry point on the break of support at 1.2245-1.2250.

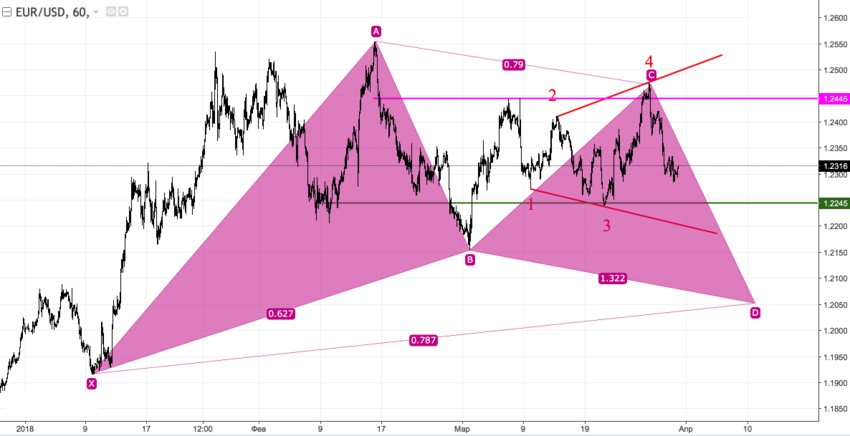
On H1 of EUR/USD, there’s a combination of “Spike and ledge” and “Widening wedge”. A break of the lower border of the consolidation range 1.2245-1.2445 will increase the possibility of a “Gartley” pattern.


EUR/USD 4H chart EUR/USD surged after Powell’s speech on Friday…

What happened? It looks like the decline in EUR/CHF to 1…

4H Chart Daily Chart EURUSD managed to rise further on Friday inline with our expectations, reaching our entire targets mentioned in our previous notes at 1…

Jerome H. Powell, the Federal Reserve chair, stated that the central bank can afford to be patient in deciding when to cut interest rates, citing easing inflation and stable economic growth. Powell emphasized the Fed's independence from political influences, particularly relevant as the election season nears. The Fed had raised interest rates to 5.3 ...

Hello again my friends, it’s time for another episode of “What to Trade,” this time, for the month of April. As usual, I present to you some of my most anticipated trade ideas for the month of April, according to my technical analysis style. I therefore encourage you to do your due diligence, as always, and manage your risks appropriately.

Bearish scenario: Sell below 1.0820 / 1.0841... Bullish scenario: Buy above 1.0827...
FBS maintains a record of your data to run this website. By pressing the “Accept” button, you agree to our Privacy policy.
Your request is accepted.
A manager will call you shortly.
Next callback request for this phone number
will be available in
If you have an urgent issue please contact us via
Live chat
Internal error. Please try again later
Don’t waste your time – keep track of how NFP affects the US dollar and profit!
