Bearish scenario: Shorts below 18100 with TP1: 17900... Anticipated bullish scenario: Intraday Longs above 18130 with TP...
2019-11-11 • Updated
Recommendation:
SELL 112.1 SL 112.65 TP1 111.1 TP2 110 TP3 109.6
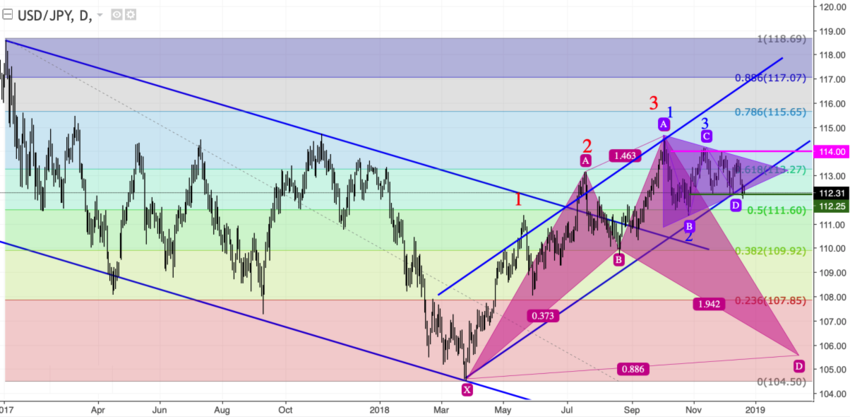
On the daily chart of USD/JPY, bears try to implement the combination of the "Three Indians" and "Spike and Ledge" reversal patterns based on the 1-2-3 one. They also try to pull the pair out of the triangle's borders and the lower border of the upward channel. If they succeed, the risks of the bullish trend's reversal and the fall towards the 88.6% target of the "Shark" pattern will increase.

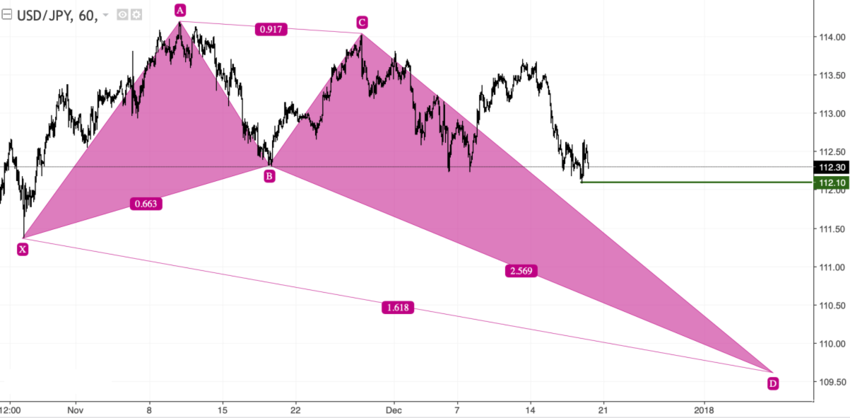
On H1, if the support at 112.1 is broken, the "Crab" pattern will be implemented again. The 161.8% target of this pattern comply with the 109.6 level.


Bearish scenario: Shorts below 18100 with TP1: 17900... Anticipated bullish scenario: Intraday Longs above 18130 with TP...

During his program on CNBC on February 28, Jim Cramer expressed frustration with the impact of earnings reports on market behavior, noting how they often prompt rash decisions by average investors. He criticized the short-term focus and lack of attention to nuance in news coverage of earnings. Cramer cited examples of Home Depot and Lowe's, highlighting how investors reacted hastily to headline news without considering the broader context provided in earnings calls.

After creating record highs, Wall Street's main indexes opened on Wednesday and began to edge lower, reflecting cautious sentiment among investors. They're eagerly awaiting crucial inflation data that could impact the U.S. Federal Reserve's interest rate decisions. The upcoming release of the personal consumption expenditures (PCE) price index is expected...

Jerome H. Powell, the Federal Reserve chair, stated that the central bank can afford to be patient in deciding when to cut interest rates, citing easing inflation and stable economic growth. Powell emphasized the Fed's independence from political influences, particularly relevant as the election season nears. The Fed had raised interest rates to 5.3 ...

Hello again my friends, it’s time for another episode of “What to Trade,” this time, for the month of April. As usual, I present to you some of my most anticipated trade ideas for the month of April, according to my technical analysis style. I therefore encourage you to do your due diligence, as always, and manage your risks appropriately.

Bearish scenario: Sell below 1.0820 / 1.0841... Bullish scenario: Buy above 1.0827...
FBS maintains a record of your data to run this website. By pressing the “Accept” button, you agree to our Privacy policy.
Your request is accepted.
A manager will call you shortly.
Next callback request for this phone number
will be available in
If you have an urgent issue please contact us via
Live chat
Internal error. Please try again later
Don’t waste your time – keep track of how NFP affects the US dollar and profit!
