- Bearish Scenario: Selling below 22.65 with TP1: 22.34 (intraday) and TP2: 22.02 (swing). It is recommended to place a stop loss around 22.80, at least 1% of the account capital**. A trailing stop can be used.
- Bullish Scenario: Buying above 22.70 with TP1: 22.90. It is recommended to set a stop loss (S.L.) below 22.60 or at least 1% of the account capital**.
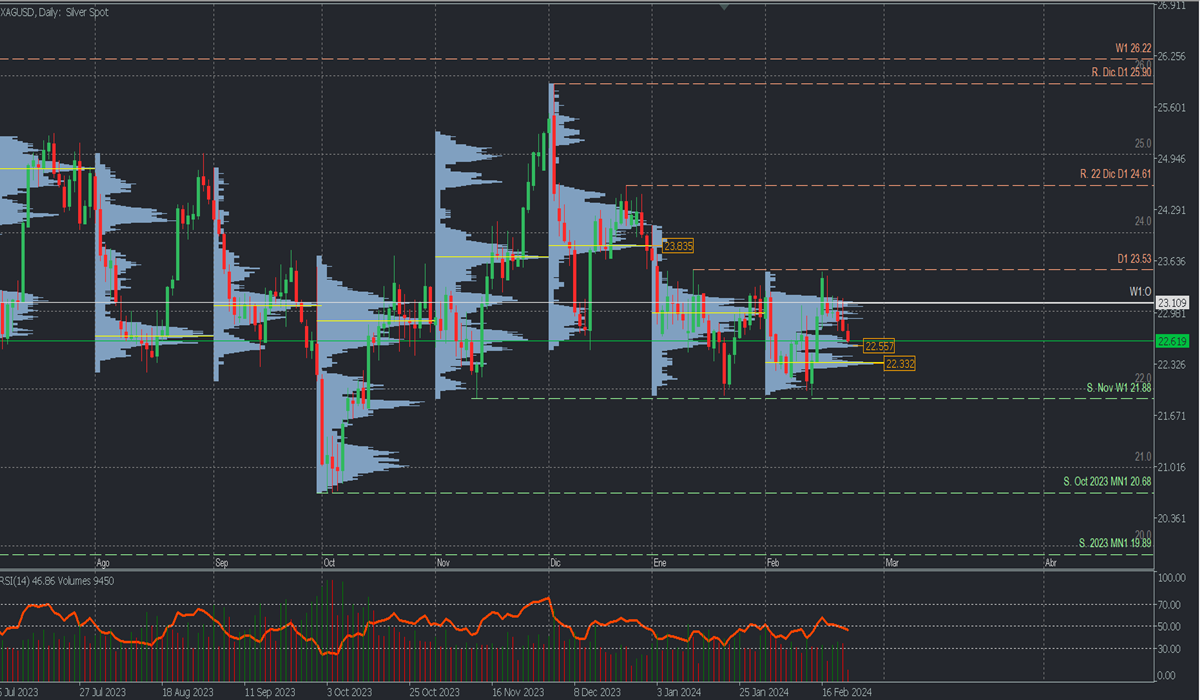
Analysis from the daily chart. Volume Profile and Structure.
XAGUSD has been consolidating since January above the November support at 21.88 and an October high volume node that has halted the price decline three times since November.
February has been forming a broad buying zone between 22.33 and 22.55, implying that as long as prices remain above this zone, a new price rally seeking to surpass the consolidation resistance at 23.53 towards the December volume concentration around 24.00 is more likely to occur.
However, a decisive breakout of the buying zone and a bearish extension below 21.88 will indicate that bearish strength outweighs buying. Consequently, the price will seek the next high liquidity zone, around the first October high volume node between 21.20 and 21.00.
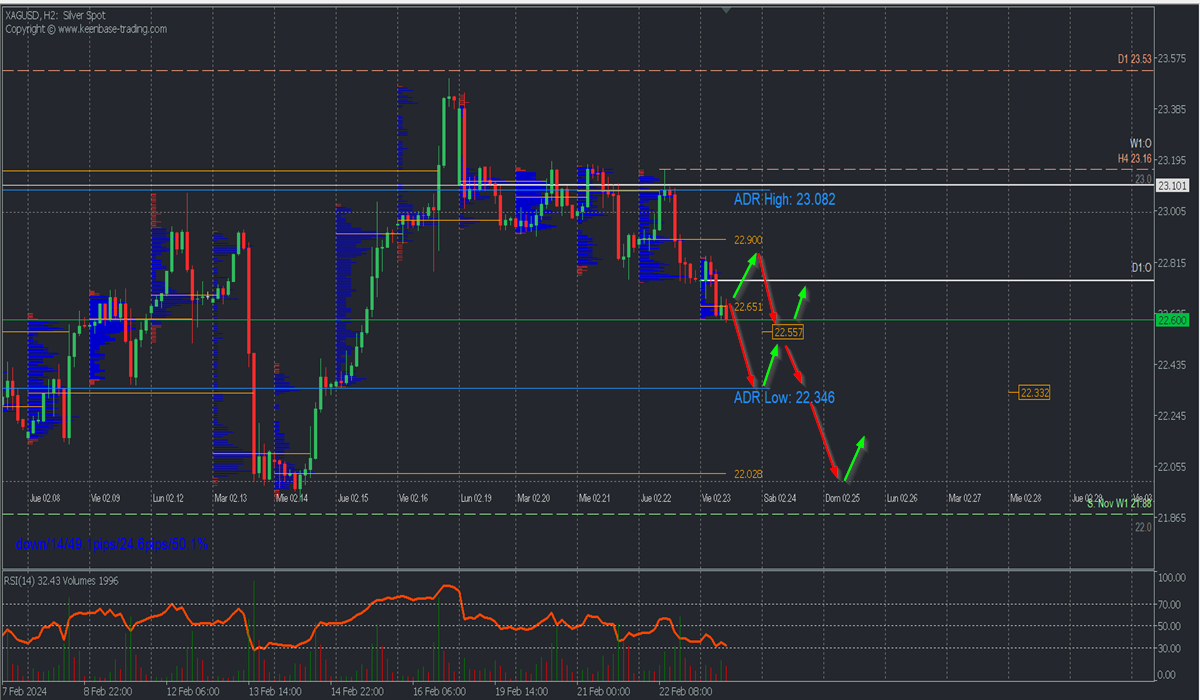
Scenario from the H2 chart:
The first possible scenario is the bearish continuation seeking more liquidity in the previously indicated buying zones, so it is observed that prices remain below yesterday's uncovered POC* at 22.90 and the Asian POC at 22.65, leaving a clear intraday bearish scenario with targets in the bearish average range of 22.34 intraday and more extendedly Monday's uncovered POC from Wednesday 14 at 22.02. Both zones can trigger bullish entry towards the previously left sales zones for a new rally.
However, if we take into account the RSI position touching the oversold zone, we can consider the possibility of an early retracement towards 22.80 and 22.90 as selling zones, from where to resume the bearish continuation towards 22.33 and even 22.02 in extension.
*Uncovered POC: POC = Point of Control: It is the level or zone where the highest volume concentration occurred. If previously, there was a bearish movement, it is considered a selling zone and forms a resistance zone. On the contrary, if previously, there was a bullish impulse, it is considered a buying zone, usually located at lows so they form support zones.
**Consider this risk management suggestion.
**It is very important that risk management is based on capital and traded volume. For this, a maximum risk of 1% of capital is recommended. It is suggested to use risk management indicators like Easy Order.
Disclaimer
—-----------------------------------------------------
This document does not constitute a recommendation to buy or sell financial products and should not be considered as a solicitation or offer to engage in transactions. This document is economic research by the author and does not intend to provide investment advice or solicit securities transactions or other types of investment at FBS. Although every investment involves some risk, the risk of loss in trading forex and other leveraged assets can be substantial. Therefore, if you are considering trading in this market, you should be aware of the risks associated with this product to make informed decisions before investing. The material presented here should not be construed