
Nesta quarta-feira (20), o Comitê Federal de Mercado Aberto – FOMC, fará a sua reunião de política monetária, às 15:00, horário de Brasília.
2022-12-15 • Atualizado
In December 2021, the main question on global markets was: “When will the FED increase the key rate?” Traders and investors were transferring their capitals into USDs, waiting for the great dump worldwide. Today, many of the “growth stocks” lost more than 50% from their highs. Since November, Bitcoin has plunged by 40%. The US indices are once again trading around the bottom border of the rising global channel.
Will this bearish trend continue, or have we already found the bottom for the next couple of months?
We believe that market members have overestimated tapering risks, and right now is the perfect moment to look for long traders in risk assets.
For example, according to the Fear & Greed index, Bitcoin has already found its global support. If you look at the picture below, you will realize Bitcoin reverses every time the crypto market’s F&G index hits 10.
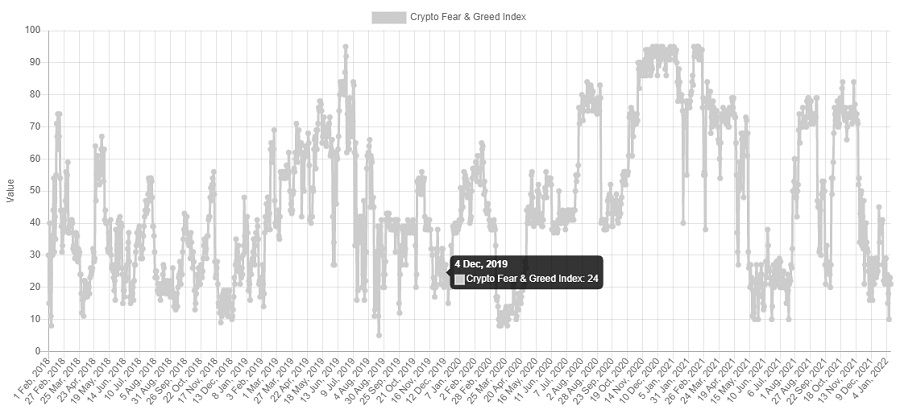
The Crypto market’s Fear & Greed index
Technical analysis
BTC/USD daily chart
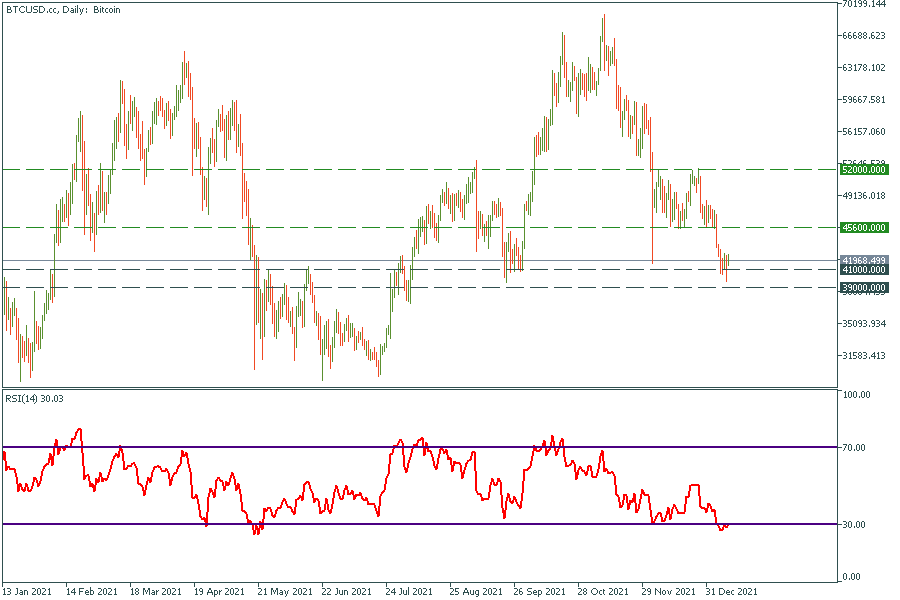
The price has reached a powerful range between $39 000 and $41 000. We can notice that the price has always reacted to these levels, so there is no doubt that the pullback will happen this time. The target for this movement is $45 600. Unfortunately, if bears can drag Bitcoin under $39000, the price will head towards $30 000.
US500 daily chart
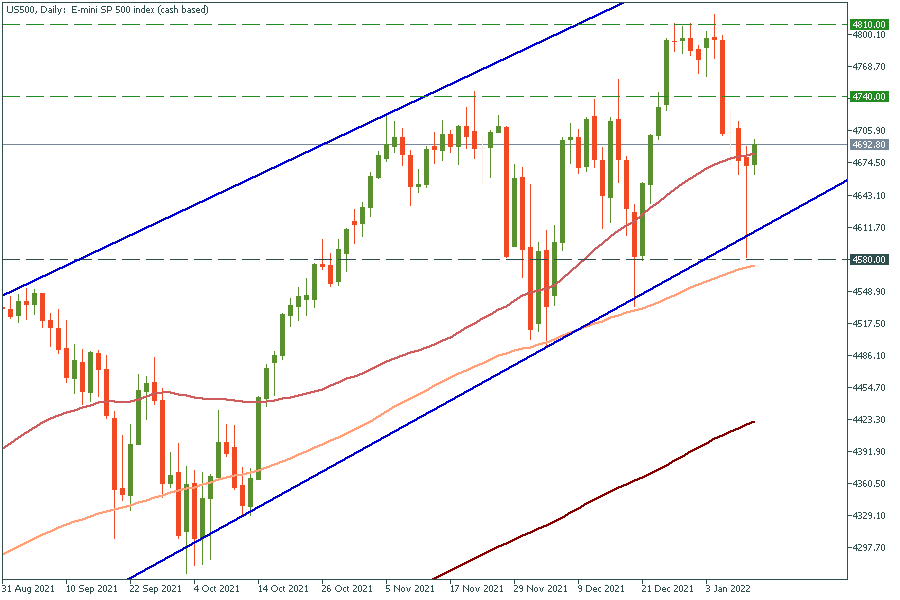
The US500 bounced off the bottom line of the global ascending channel again. The 100-day moving average is still an insurmountable barrier for sellers. We expect the US500 to renew its all-time high by mid-February. As soon as the price breaks through 4810, it will head towards 4870.
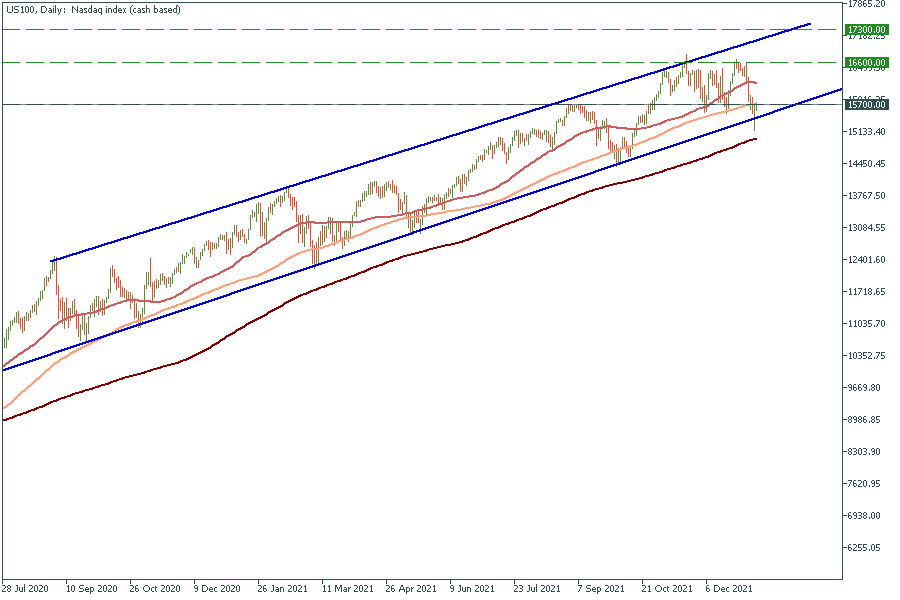
The US100 index has also bounced off the global trend line. The triple bottom pattern has appeared on the chart. As soon the price breaks through 16 600, it will reach 17 300.

Nesta quarta-feira (20), o Comitê Federal de Mercado Aberto – FOMC, fará a sua reunião de política monetária, às 15:00, horário de Brasília.
O Bureau of Labor Statistics do Departamento do Trabalho dos EUA divulga sua leitura mais recente sobre o índice de preços ao consumidor (IPC) nesta terça-feira, às 09:30 GMT -3
O calendário econômico para os EUA promete mexer com os índices US 30, US 100 e US 500, já que os investidores estarão atentos aos dados macroeconômicos a serem publicados ao longo da semana em especial o índice do PCE e no final da temporada de lucros corporativos

Depois da queda no mês de março em cerca de 26 mil vagas de emprego, a expectativa do mercado é de nova queda para 8,790M para o mês de fevereiro do mesmo ano

Nesta segunda-feira, primeiro dia do mês de abril, os EUA liberam os números dos PMIs da S&P Global e do ISM para a indústria

Todas as atenções estarão nos preços básicos do PCE (núcleo) dos EUA, que excluem alimentos e energia para o mês de março, com a expectativa de que os números venham abaixo do mês anterior, que registraram um aumento de 0,4%
A FBS mantém registros de seus dados para operar este site. Ao pressionar o botão “Aceitar“, você concorda com nossa Política de Privacidade.
Seu pedido foi aceito
Um gerente ligará para você em breve.
O próximo pedido de chamada para este número de telefone
estará disponível em
Se você tiver um problema urgente, por favor, fale conosco pelo
Chat ao vivo
Erro interno. Por favor, tente novamente mais tarde
Não perca seu tempo. Acompanhe o impacto das NFP no dólar dos EUA e ganhe dinheiro!
