
A decisão de taxas do FOMC promete movimentar o mercado
Nesta quarta-feira (20), o Comitê Federal de Mercado Aberto – FOMC, fará a sua reunião de política monetária, às 15:00, horário de Brasília.
2022-12-15 • Atualizado
Warren Buffett, the American businessman and philanthropist, has put most of Berkshire Hathaway’s cash in short-term United States Treasury bills since they offer as much as 3.43% in yields.
Another famous trader, Michael Burry, also bets against risk assets. His Scion Asset Management Fund has released transaction data for the Q2 of 2022. Burry sold all the securities in the portfolio and bought only shares of the real estate fund (REIT) Geo Group, which invests in private prisons worldwide.
This news signal the negative mood of major investors regarding risky assets. Moreover, based on their actions, we can assume that the worst for the stock market and cryptocurrencies is yet to come.
Treasury bills, or T-bills, are US government-backed securities that mature in less than a year. Investors prefer them over money-market funds and certificates of deposit because of their tax benefits.
Berkshire’s net cash was $105 billion as of June 30, out of which $75 billion, or 60%, was held in T-bills.
The move is likely a response to bond yields jumping massively since August 2021 in the wake of the Federal Reserve’s hawkish policies aimed at curbing inflation, which was running at 8.4% in July.
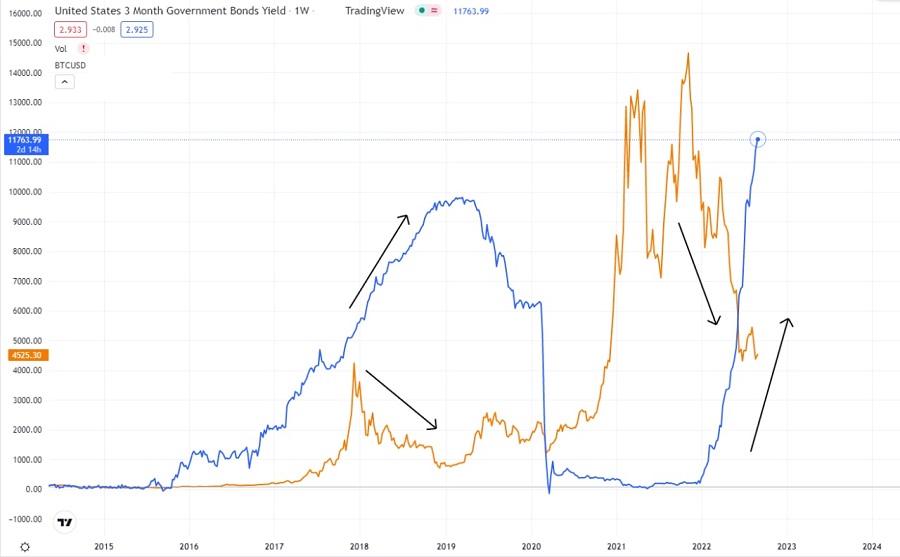
US 3-month bond yield versus BTCUSD weekly timeframe chart. Source: TradingView
Meanwhile, non-yielding assets like gold and Bitcoin have dropped roughly 5.3% and 63% since August 2021. S&P 500 (US500) declined by 12% in the same period.
Such a difference in performance presents T-bills as an ultra-safe alternative for investors compared with gold, Bitcoin, and stocks. Buffett’s T-bill strategy also suggests a bet on more downside for risk-on assets in the near term as the Fed promises more rate hikes in the near term.
The problem is that Michael Burry and Warren Buffet publish their traders, allowing their small traders to follow their decisions. This fact may indicate that retail investors might get rid of risky assets over the following months in favor of 3% in yields.
Moreover, in the current market sentiment, large investors who oppose risks, such as pension funds and hedge funds, will bypass risky assets and give preference to yield assets. It will continue to put significant pressure on the price of risky assets and force the most impatient investors to close positions at a loss.
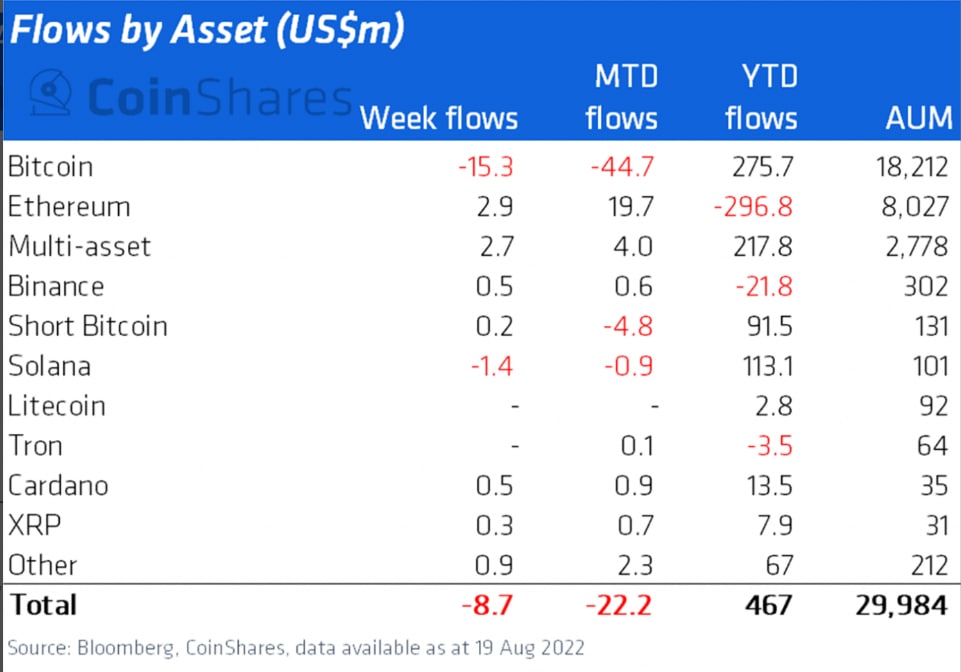
This fact is confirmed by the performance of Bitcoin-focused investment funds in August, with capital outflows for three weeks, including a $15.3 million exit in the week ending August 19.
Unfortunately for crypto fans, Bitcoin won’t make any reverse until the Federal Reserve gives any hints regarding the monetary policy easing. At the Jackson Hole Symposium, Jerome Powell stated that the rates would go up until inflation hit the targeted 2%.
Moreover, in June, Powell stated a possible easing might start in 2024, which matches with Bitcoin halving, an event where mining rewards are cut in half. Usually, Bitcoin starts a new cycle of growth right after this event.
BTCUSD, daily chart
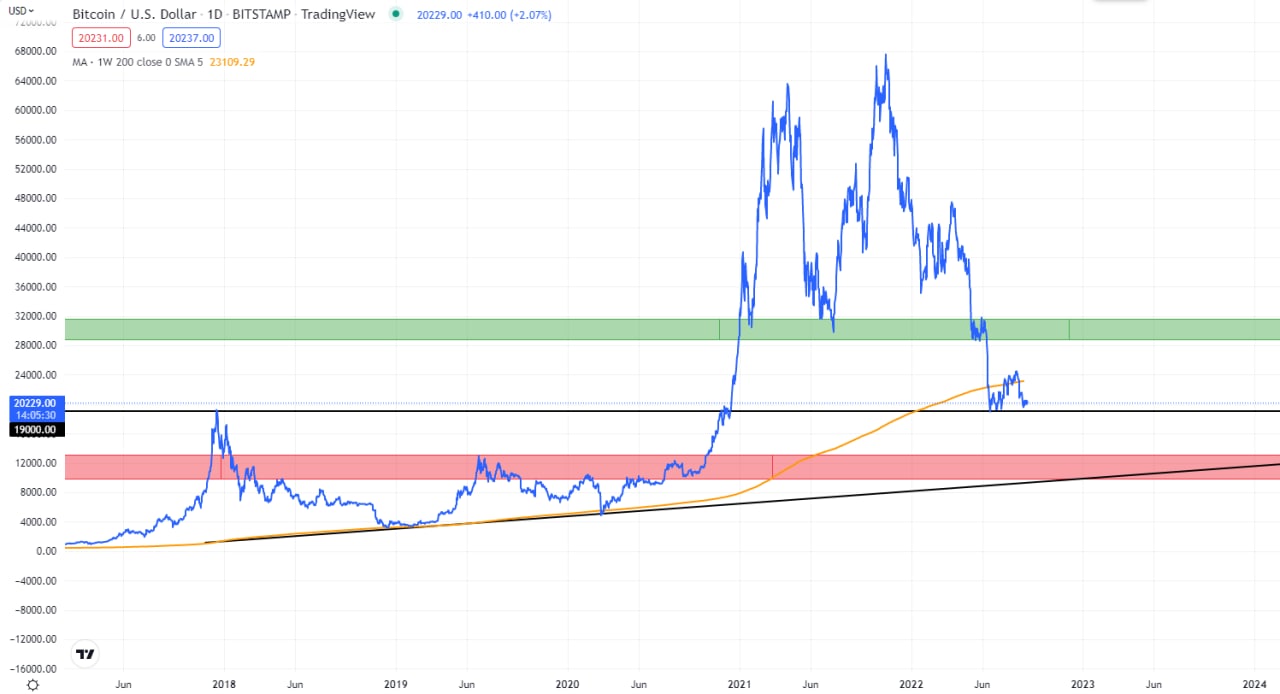
BTCUSD is trading between the historic support level of $19 000, a 2017 all-time high, and the 200-week moving average, which traders always treated as the main support. However, as we can notice, the price broke below the moving average, which now acts as a phycological resistance.
If buyers push the price above this line, they might pump it to 28 000 – 32 000 resistance level, which might be quite hard in the current market conditions.
The more realistic variant is the decline below 19 000 and further drop towards the range between 9000 and 13 000. In this case, the price will touch a global trendline and start a new growth cycle.
S&P500 (US500), monthly chart
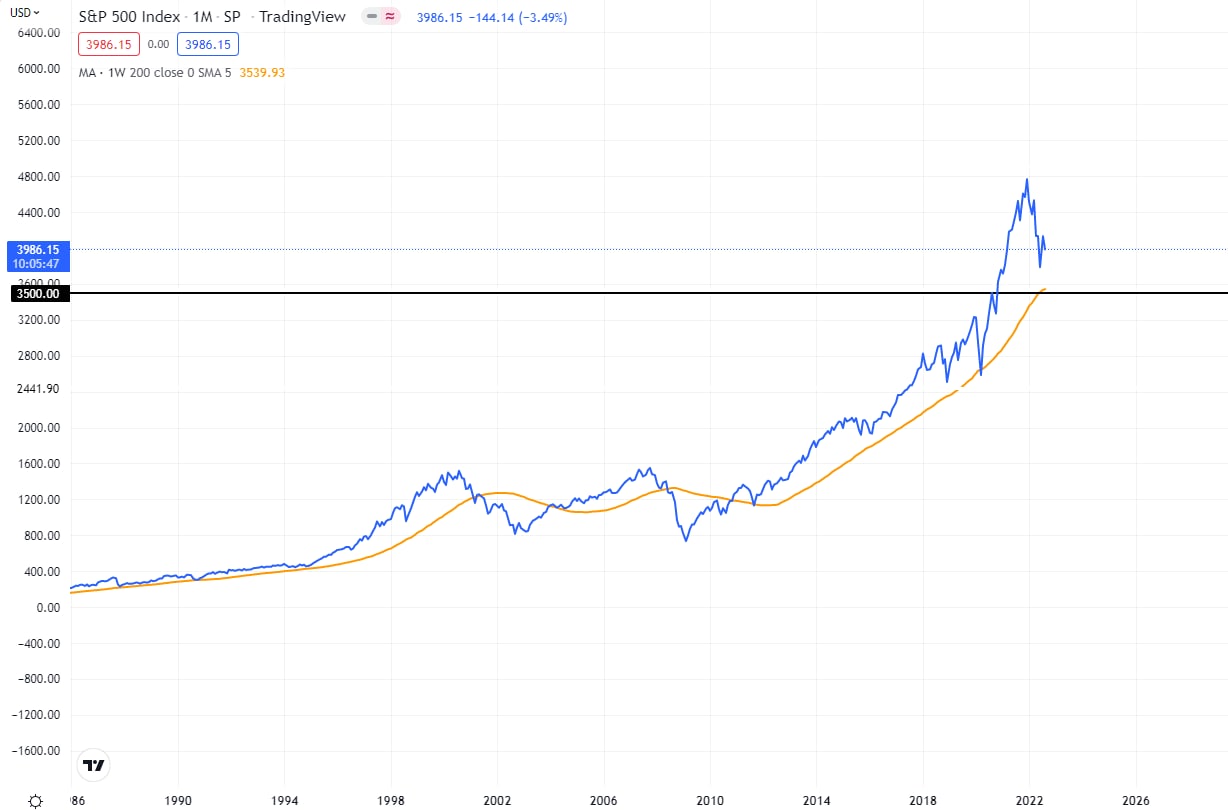
As we can notice, US500 loves to flirt with the 50-week moving average. We can notice that both times, in 2001 and 2008, the US economy entered a significant financial crisis after the breakout of this support line. Therefore, there is no doubt that US500 will reach the range of 3500 – 3600, where the future of the whole US economy will be decided.
Do you want to get updates Live? Subscribe to the @FBSAnalytics Telegram Channel, where I post more daily trade ideas!

Nesta quarta-feira (20), o Comitê Federal de Mercado Aberto – FOMC, fará a sua reunião de política monetária, às 15:00, horário de Brasília.

O Bureau of Labor Statistics do Departamento do Trabalho dos EUA divulga sua leitura mais recente sobre o índice de preços ao consumidor (IPC) nesta terça-feira, às 09:30 GMT -3
O calendário econômico para os EUA promete mexer com os índices US 30, US 100 e US 500, já que os investidores estarão atentos aos dados macroeconômicos a serem publicados ao longo da semana em especial o índice do PCE e no final da temporada de lucros corporativos
Depois da queda no mês de março em cerca de 26 mil vagas de emprego, a expectativa do mercado é de nova queda para 8,790M para o mês de fevereiro do mesmo ano

Nesta segunda-feira, primeiro dia do mês de abril, os EUA liberam os números dos PMIs da S&P Global e do ISM para a indústria
Todas as atenções estarão nos preços básicos do PCE (núcleo) dos EUA, que excluem alimentos e energia para o mês de março, com a expectativa de que os números venham abaixo do mês anterior, que registraram um aumento de 0,4%
A FBS mantém registros de seus dados para operar este site. Ao pressionar o botão “Aceitar“, você concorda com nossa Política de Privacidade.
Seu pedido foi aceito
Um gerente ligará para você em breve.
O próximo pedido de chamada para este número de telefone
estará disponível em
Se você tiver um problema urgente, por favor, fale conosco pelo
Chat ao vivo
Erro interno. Por favor, tente novamente mais tarde
Não perca seu tempo. Acompanhe o impacto das NFP no dólar dos EUA e ganhe dinheiro!
|


