EUR/USD 4H chart EUR/USD surged after Powell’s speech on Friday…
2019-11-11 • Updated
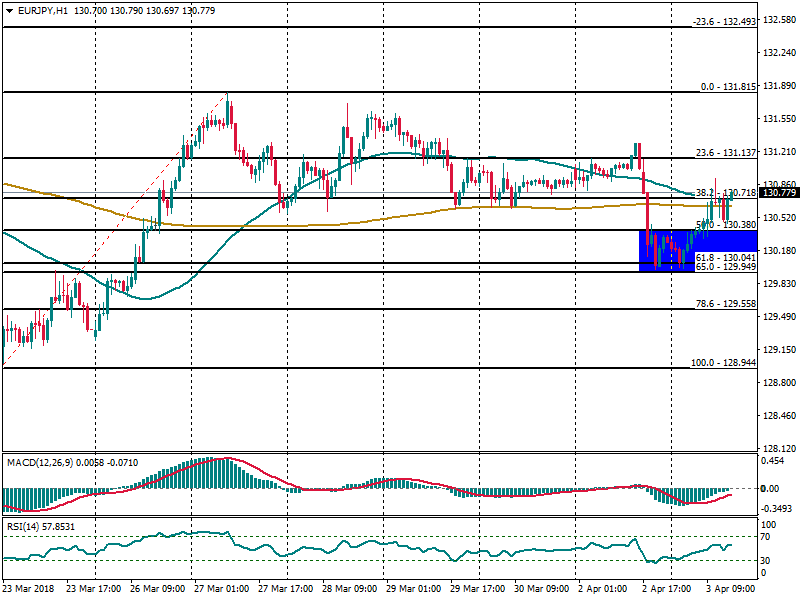
EUR/JPY is hovering around the 200 SMA at H1 chart after having found support in the Fibonacci level of 61.8% at 130.04. We cannot discard a possible leg lower to test the Fibonacci area of 78.6% at 129.55, as the price action is starting to show a bearish divergence in the MACD indicator. That could put us in focus toward the Fibonacci level of -23.6% at 132.49 once it breaks above March 27th highs.
RSI indicator remains steady in the neutral territory.


EUR/USD 4H chart EUR/USD surged after Powell’s speech on Friday…

What happened? It looks like the decline in EUR/CHF to 1…

What happened? Japanese shares fell on Monday…

Jerome H. Powell, the Federal Reserve chair, stated that the central bank can afford to be patient in deciding when to cut interest rates, citing easing inflation and stable economic growth. Powell emphasized the Fed's independence from political influences, particularly relevant as the election season nears. The Fed had raised interest rates to 5.3 ...

Hello again my friends, it’s time for another episode of “What to Trade,” this time, for the month of April. As usual, I present to you some of my most anticipated trade ideas for the month of April, according to my technical analysis style. I therefore encourage you to do your due diligence, as always, and manage your risks appropriately.

Bearish scenario: Sell below 1.0820 / 1.0841... Bullish scenario: Buy above 1.0827...
FBS maintains a record of your data to run this website. By pressing the “Accept” button, you agree to our Privacy policy.
Your request is accepted.
A manager will call you shortly.
Next callback request for this phone number
will be available in
If you have an urgent issue please contact us via
Live chat
Internal error. Please try again later
Don’t waste your time – keep track of how NFP affects the US dollar and profit!
