Bitcoin undergoes a halving approximately every four years, halving the rate of new Bitcoin creation. The last three occurred in 2012, 2016, and 2020, with the upcoming one expected in April 2024. This process regulates Bitcoin's supply, contributing to its scarcity and controlled issuance, ensuring a stable and valuable asset. Halving impacts miners, and market competition, and is historically associated with price increases due to reduced supply and growing demand. While it brings potential positives, it also introduces increased volatility to the Bitcoin market.
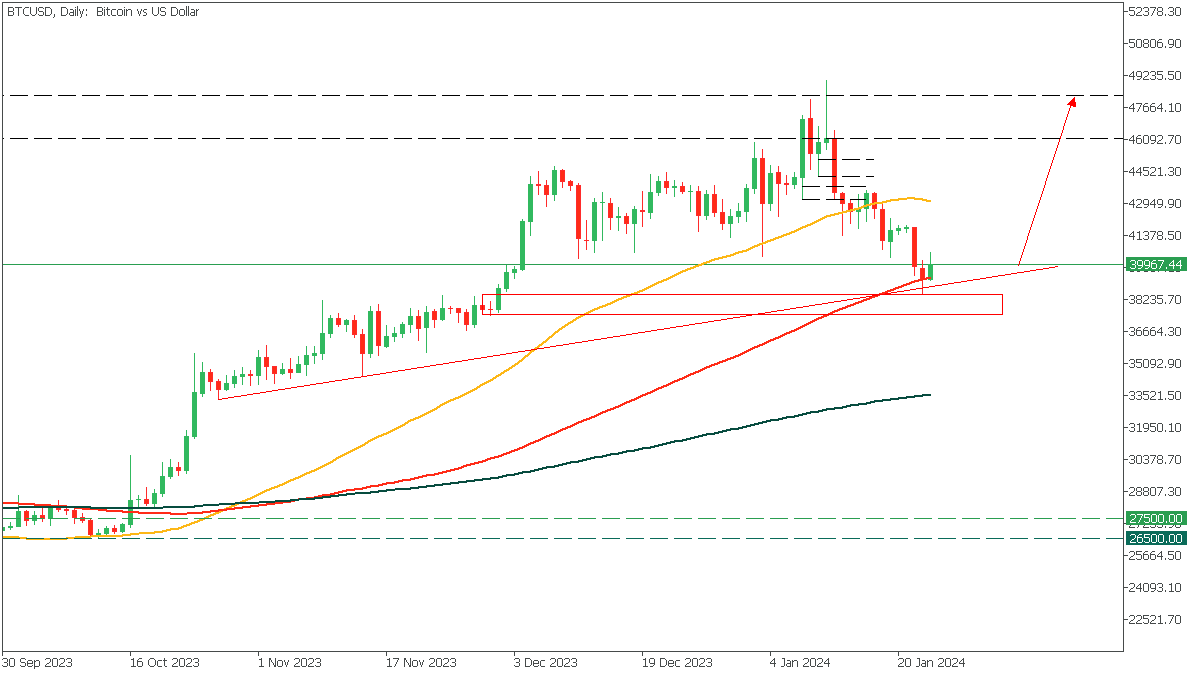
BTCUSD - Daily Timeframe

Bitcoin took a nose-dive shortly after crossing the $47k mark and the SEC approval of a Bitcoin spot ETF. The bearish move initially threw off a few retail investors, but given that price is currently reacting to a confluence of trendline support, moving average support, and demand zone areas whilst retaining a bullish moving average array tells me the market could be gearing up for another bullish rally.
Analyst’s Expectations:
Direction: Bullish
Target: $50,000
Invalidation: $38,000
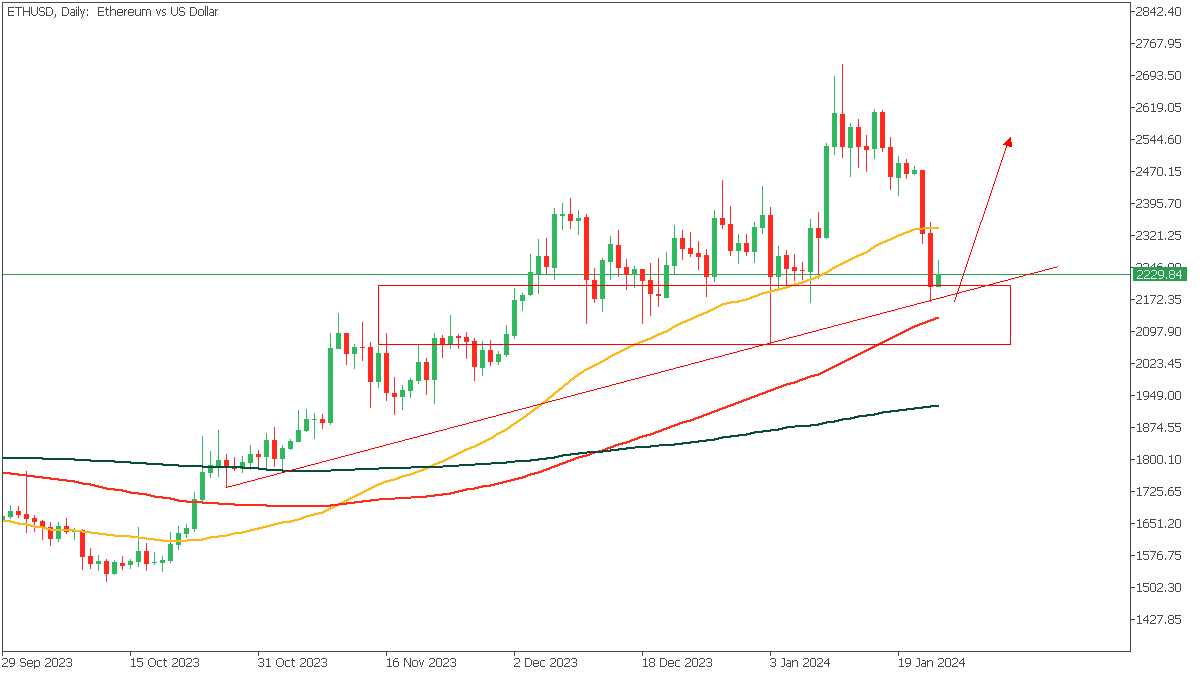
ETHUSD - Daily Timeframe

ETHUSD as seen from the chart is currently sitting on a major demand zone, with credible confluence from the trendline support, 100-day moving average support, bullish moving average array, and the 76% of the Fibonacci retracement tool; which I have deliberately not plotted on the chart so that the price action can be seen clearly. Here, my sentiment is also bullish.
Analyst’s Expectations:
Direction: Bullish
Target: $2,750
Invalidation: $2050
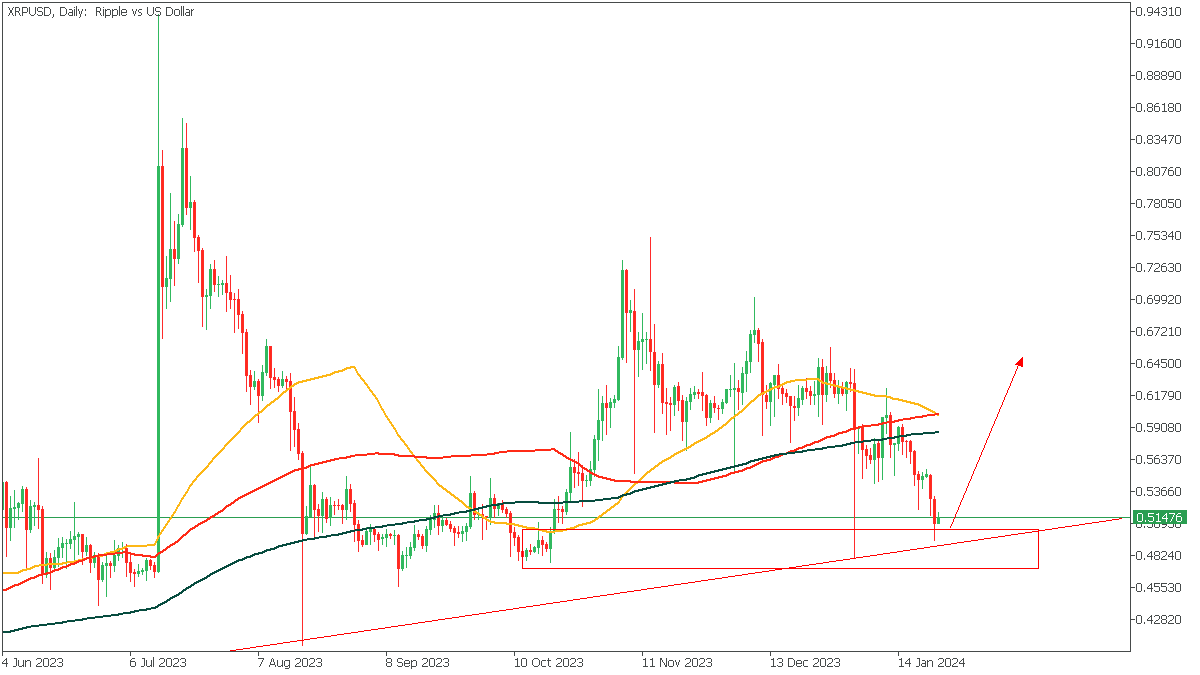
XRPUSD - Daily Timeframe

Ripple may be preparing for a bullish run of its own too, since we currently have price reacting from the demand zone, supported by a trendline, and the bullish array of moving averages as seen in the previous commodities. I expect price to reach my target at the 200-day moving average.
Analyst’s Expectations:
Direction: Bullish
Target: 0.59749
Invalidation: 0.47383
CONCLUSION
The trading of CFDs comes at a risk. Thus, to succeed, you have to manage risks properly. To avoid costly mistakes while you look to trade these opportunities, be sure to do your due diligence and manage your risk appropriately.
TRY TRADING NOW
You can access more of such trade ideas and prompt market updates on the telegram channel.


