What do the monthly charts say?
Sometimes it’s worth analyzing big timeframes in order to get important trading hints. Below you will find some observations from the monthly charts that can provide you with trade ideas.
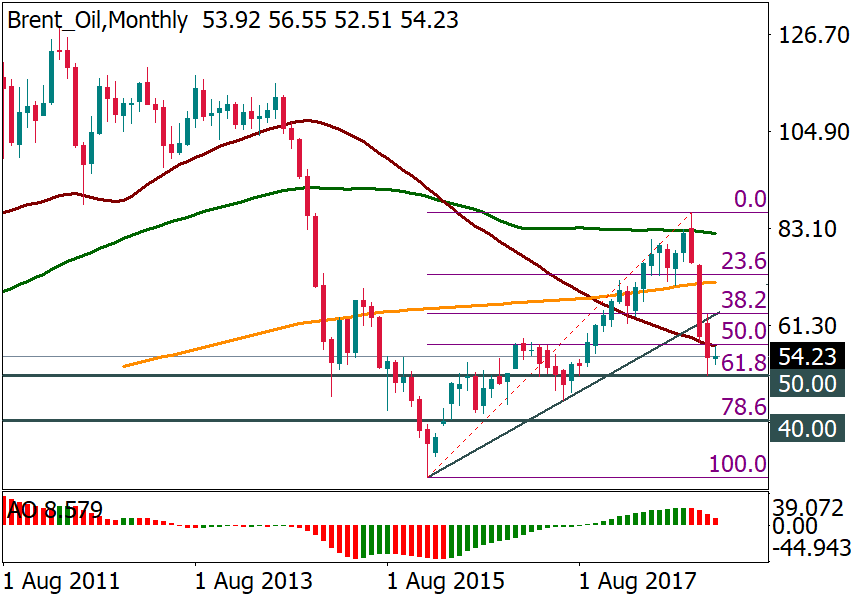
Brent oil fell below 50-month MA that will now act as resistance at 57.00. If the price loses the support of 50.00, the next big target will be at 40.00.
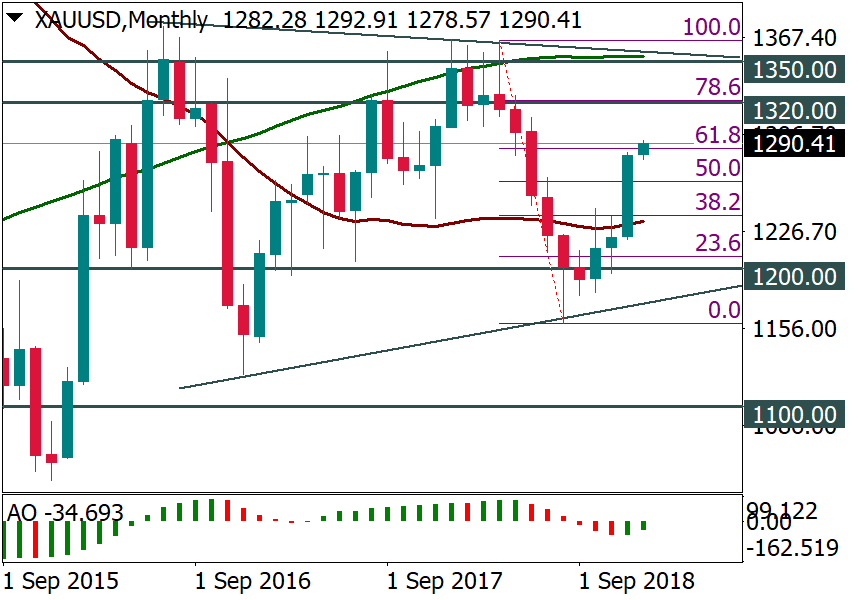
Gold had a very positive month. The natural area of attraction for the price will be at 1320 and 1350. Support is at 1234 (50-month MA).
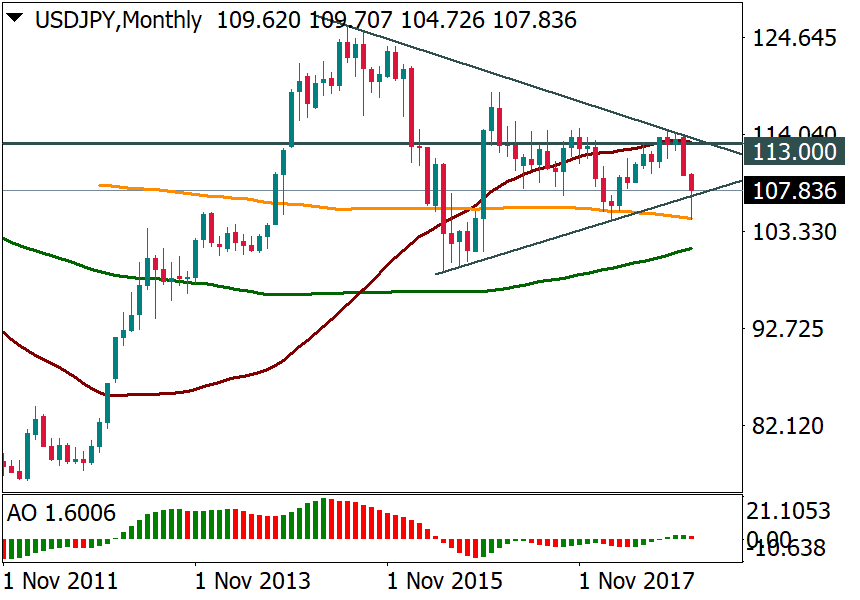
USD/JPY is supported by the 200-month MA at 105.80, while the upside is limited by 113.00. The pair lacks momentum and may stay in this range.
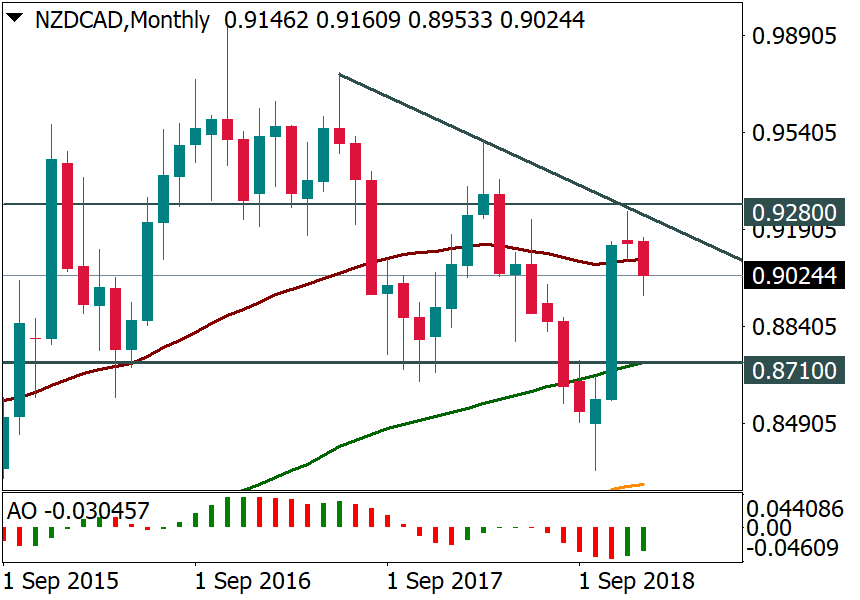
NZD/CAD met resistance and formed a very small candlestick in December. Further downside seems likely.
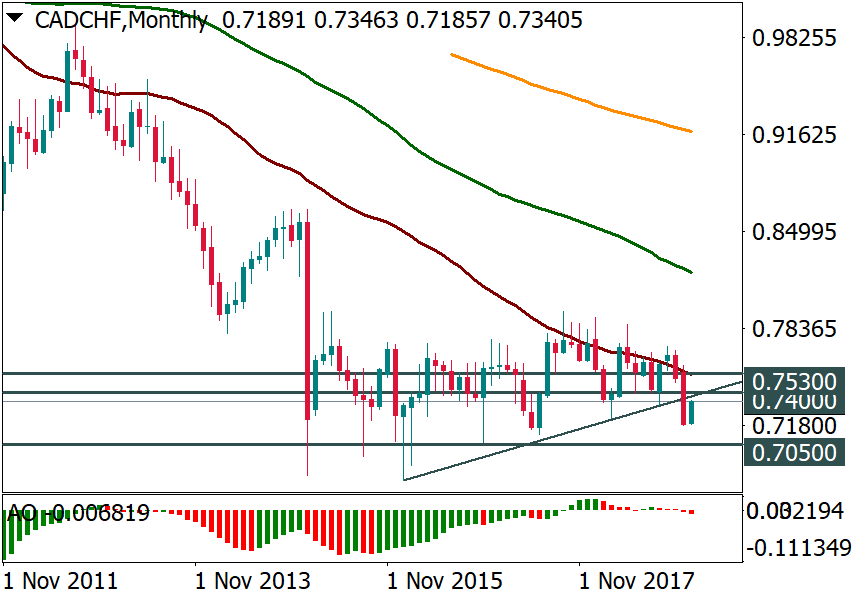
CAD/CHF has strong resistance at 0.7400 and 0.7530. The recovery seems temporary.
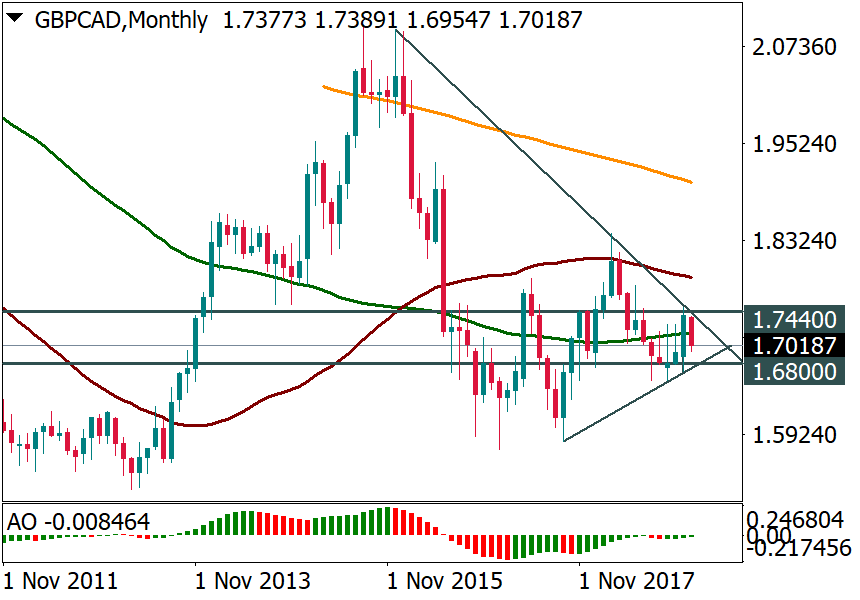
GBP/CAD met resistance at 1.7440. The natural target is at 1.68.
