Trade Ideas to Follow This Week
EUR/USD
4H chart
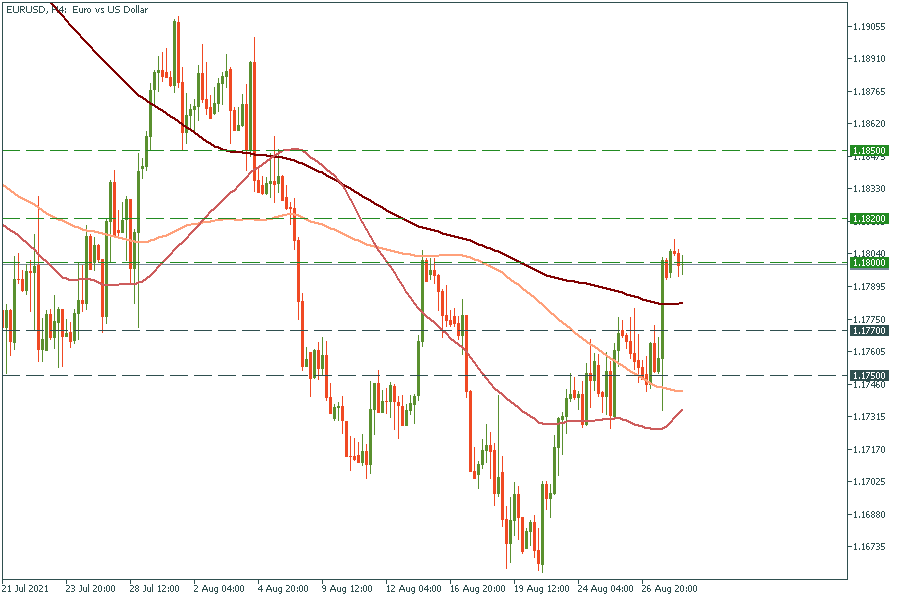
EUR/USD surged after Powell’s speech on Friday. At the moment, it is trading around the key resistance of 1.18. Led by European countries' CPI and GDP reports during this week the EUR might get stronger and push the pair higher. If it breaks through the way to 1.182 and 1.185 will be open. Otherwise, we might see a pullback down to 1.177 and 1.175.
Brent
4H chart
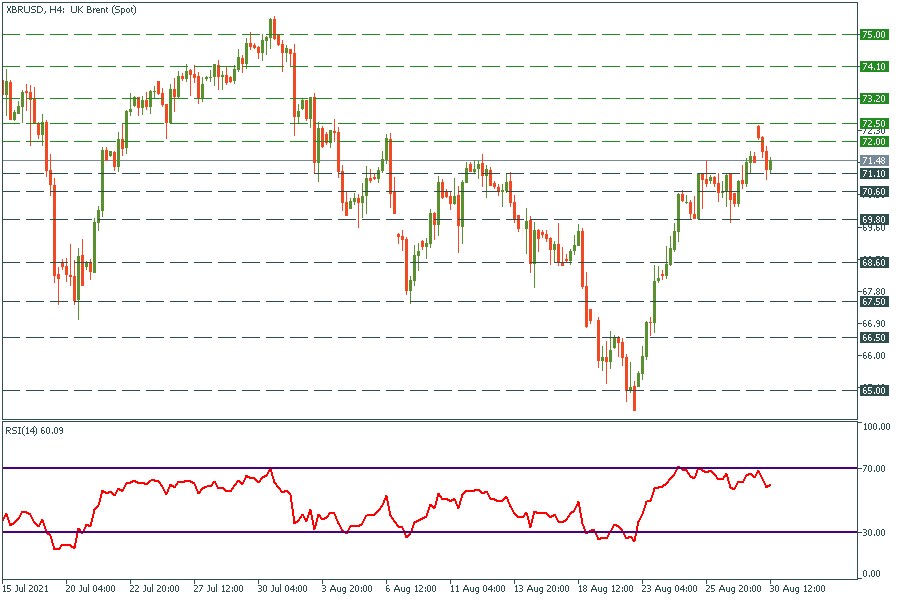
Oil demonstrated the best week since the beginning of the Covid-19 pandemic. It also opened with a big gap on the Monday trading session but managed to close it shortly. It played out all the bearish divergences and at the moment there are no signs of the upcoming pullback. The upcoming OPEC+ decision about supply reduction might push it even higher. $72.5, $73.2, $74.1, and $75 are the main targets.
Alibaba
Alibaba is still under pressure from the Chinese government, but concerns get easier as time pass. During last week Alibaba has been trading sideways and by the end of the week closed at the same price level as opened at the beginning. This week might define the middle-term trend for Alibaba stock price.
4H chart
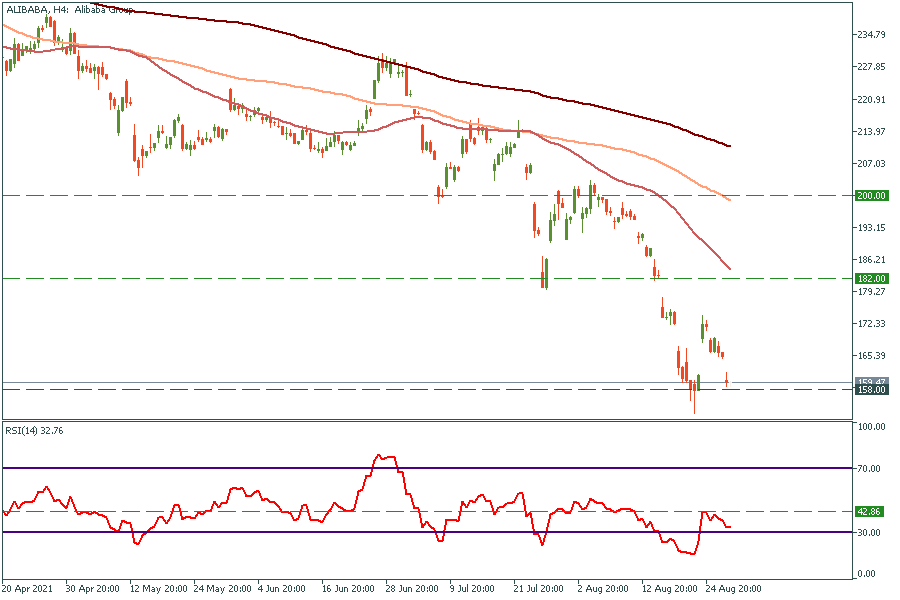
The RSI “swing rejection” pattern may occur on the 4H chart. As soon as 4H RSI closes above 42.86 (on condition it doesn’t drop below 30) this pattern will be proved. In this case, the targets will be $182 and $200.
Bitcoin
Daily chart
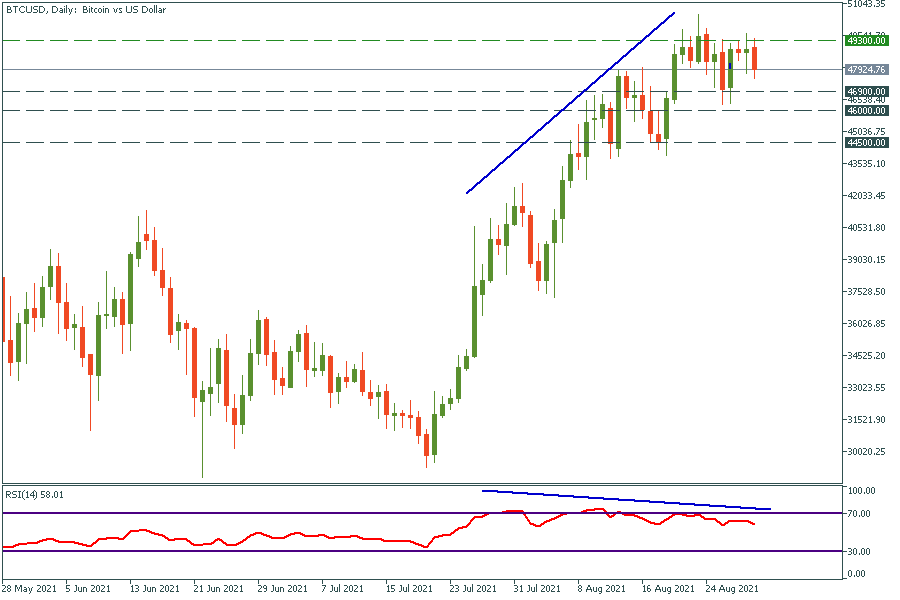
The bearish divergence occurred on Bitcoin daily chart.
4H chart
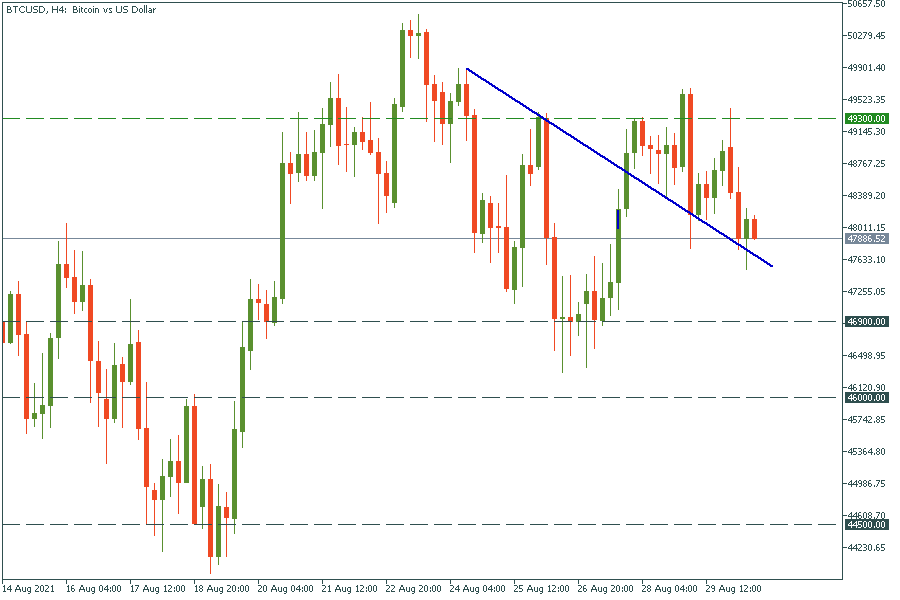
The asset has formed the support line. If the price closes below this support, it will be a bearish sign for Bitcoin. In this case, it will drop to $46 900, $46 000, and $44 500, which are the main support levels for now.
$49 300 - $49 500 is a massive resistance range at the moment. If the price comes there, it will be a good opportunity to open a short trade.