S&P: a brighter future
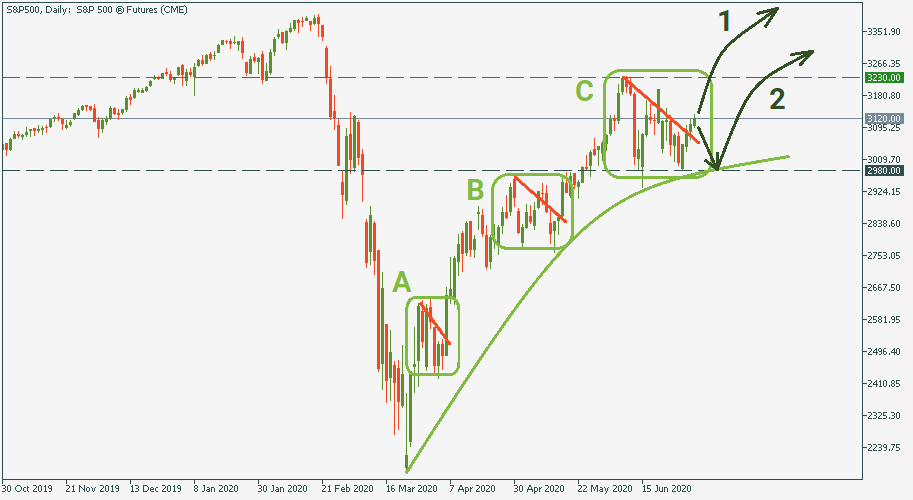
We have previously advised not to get too scared of a second-wave-caused stall in the stock market. Specifically, we suggested that 3 000 (2 980 to be precise) would serve as a likely bottom for the current sideways movement of the S&P and that this movement will be somewhat prolonged compared to similar periods in the previous several months. We are still maintaining that point. See the below chart.

We had periods A and B where the S&P made a similar stop with lower-highs chart formations. Each time, it preceded a breakthrough growth to a higher baseline level. Currently, we are in the C-section. Even if it transforms into a breakthrough right now, it will already become the largest drawback among the three. Nevertheless, it doesn’t change the market logic. In fact, naturally, the higher and the closer the S&P’s trajectory gets to pre-virus dynamic, the less steep the inclination of the curve will be.
Hence, it is only reasonable to expect that the current sideways channel may take even longer before it completely exhausts itself. For this reason, and optimistic scenario 1 suggests that the current bullish move will be the beginning of a breakthrough to yet a higher baseline level. In the meantime, a moderate scenario 2 suggests that somewhere on the way to the resistance of 3 230 there will a bearish reversal, which still will convert into an upward trend after it bounces from the support at 2 980.
The long-term and mid-term projections provided by observers lately give enough positive fundamentals to consider both scenarios as quite possible. For this reason, get prepared, it looks like we are in for a good season at the stock market and the S&P.