Long-term charts you should look at
How often do you check the weekly and monthly charts? Do you do this for many currency pairs? Whatever you are doing, you can certainly do more! Let’s have a look at some interesting long-term charts. There may be good signals there.
EUR/USD
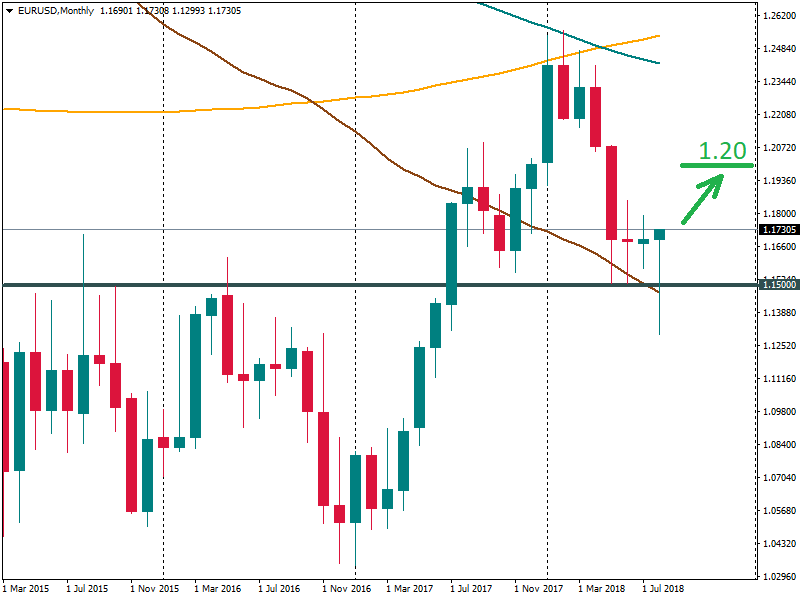
August candlestick opened at 1.1690. A monthly close near this level will mean a formation of a “Fakey” pattern – an inside bar + a false break to the downside. The pattern may imply a recovery to 1.20.

USD/CHF
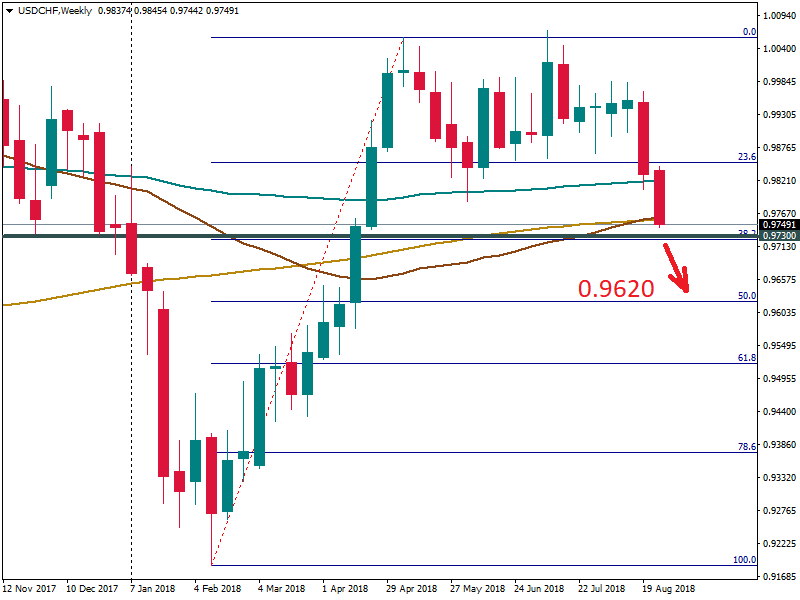
EUR/USD and USD/CHF tend to move in the opposite directions. Is there a double top on the weekly chart? Weekly moving averages have already given in. Support is at 0.9730 (Fibonaccci and 50-month MA). A decline below this level will open the way down to 0.9620.

USD/CAD
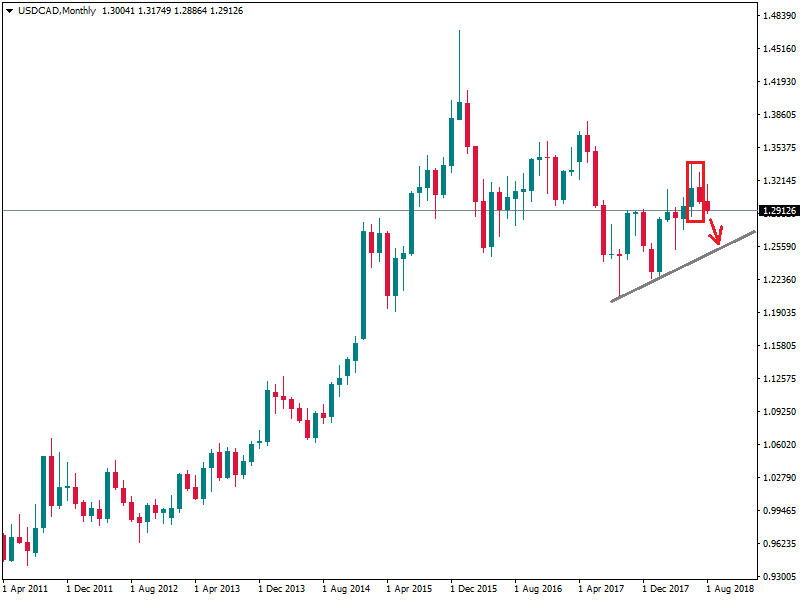
There’s a bearish “Harami” pattern on the monthly chart. If we get a confirmation in form of the negative August candlestick (monthly close below 1.30), further decline will be likely. The targeted support level will lie in the 1.2550 area.
