GBP/USD: trade the epic breakthrough
GBP/USD is gradually making a big breakthrough both on a strategic and tactical level.
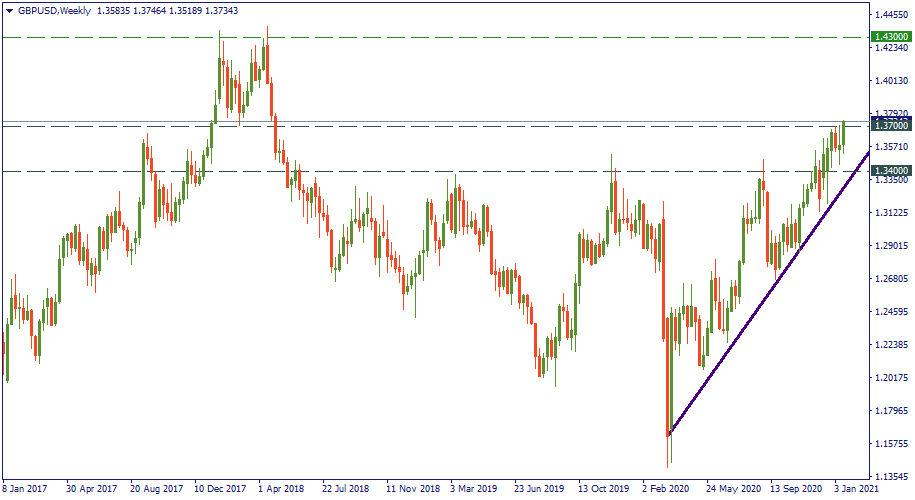
In the long term, 1.37 is the gateway to the highs of 2017. Therefore, the pair is now in the four-year resistance zone. 1.43 is the long-term target for bulls. It may take a few months – or weeks – for GBP/USD to get there. Therefore, if you like position trading – that’s definitely your chance. However, be prepared to see corrections on the way: 1.34 may be a possible checkpoint for a bearish reversal in the long run.

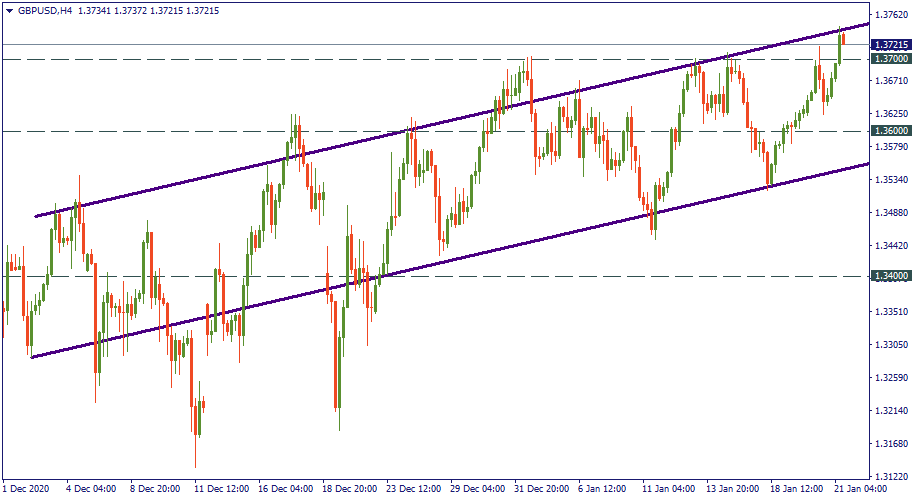
In the midterm, you will see that most the currency pair performance is contained with the channel marked in the below H4 chart. You will note that GBP/USD frequently deviates from the channel and breaks through the border of the channel. So far, going above 1.37 doesn’t cross the upper side, but still – don’t be surprised if it goes down to 1.36 before making another upswing and continuing the mid-term uptrend.
Primary scenario: the price bounces downwards, dips below 1.37, possibly drops to 1.36, reverses upwards again
Secondary scenario: the price goes significantly above 1.37, corrects downwards to touch 1.37 or dip slightly below it, gets back to the upside.
