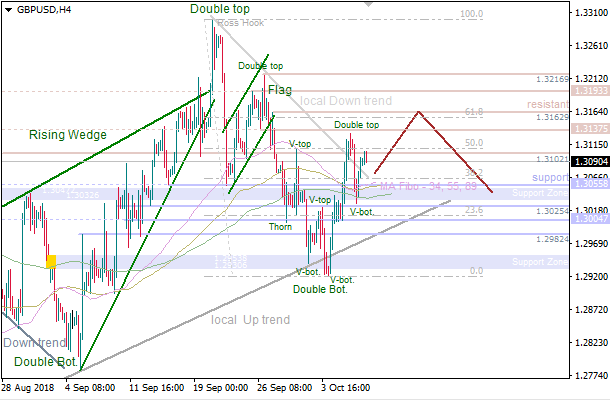
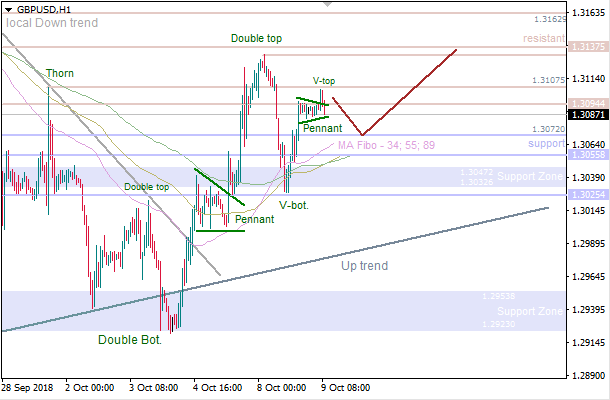
GBP/USD: 'V-Bottom' pushing price higher

There's a 'V-Bottom' pattern, so the price is likely going to test the nearest resistance at 1.3137 - 1.3162 in the short term. A pullback from this area could be a starting point for a decline towards the Moving Average lines.

We've got a local 'V-Top', which means there's a moment for an intraday downward correction. In this case, we should watch the closest support at 1.3072 as a bearish target. If a pullback from this level happens next, bulls will probably try to deliver a new local high.