Are there any chances for EUR/USD to overcome 1.23?
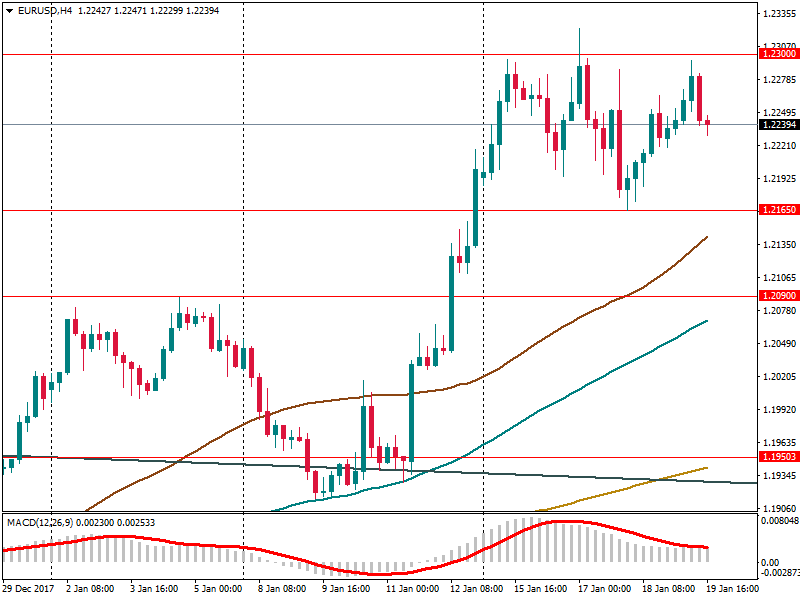
This week the EUR/USD pair showed wavy dynamics with growth and falls after the great growth on Friday, January 12. Euro started a week with the lower price than closed the last week session. But after that, we could see continuing growth until the price 1.23 that formed the resistance of this week, that it reached 3 times this week. The price managed to hit this line once this week reached the top at 1.2322, the highest level in 3 years. However, it could not continue its way to the upside. None of the candlesticks of the daily chart was able to close above 1.23. The lowest price was at the level 1.2165.

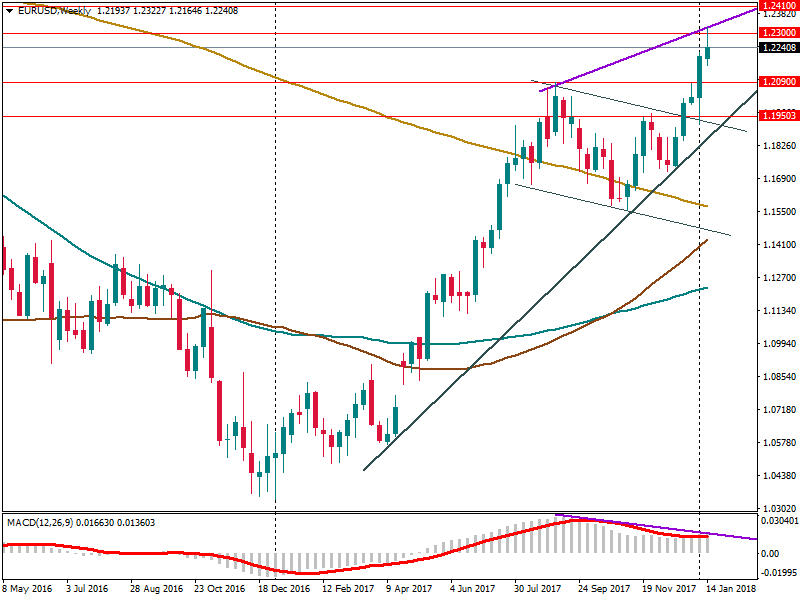
The long-term trend since the start 2017 is bullish and will remain so as long as the pair will trade above support line at 1.1950. On the daily chart 50-day MA went above 100-day MA. So the pair still has a chance to finally overcome 1.23. On the weekly chart, MACD indicator did not confirm the price high. As a result, EUR/USD may firstly decline to support levels before resuming the long-term uptrend.

Support levels are at 1.2165, 1.2090. Resistance is at 1.23, 1.2350.