2020 year-end currency trends review
EUR/USD: decade’s end
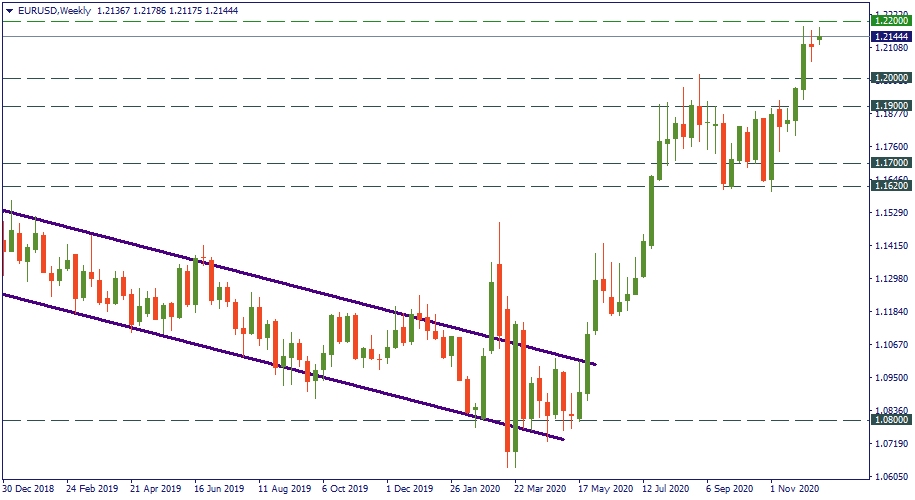
The year 2020 started with the EUR/USD touching the bottom of 1.08 as it was making the way for the downtrend through the entire 2019. After a fierce shock easily visible as heavy fluctuation in February-March, the pair reversed and started actively marching upwards. Eventually, the EUR appreciated against the USD as high as 1.20 by December, coming closer even to 1.22. By climbing this high, EUR/USD recovered all the losses of 2019 and came to the heights of January-April 2018.
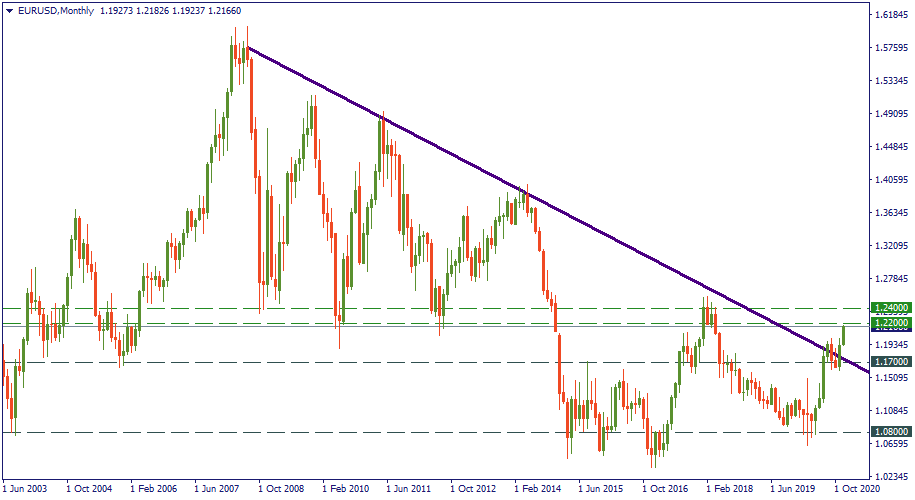
On the monthly chart, breaking through 1.22 would challenge the decade-long downtrend EUR/USD has been in so far. However, technically, only beating 1.24 would confirm the possibility of this strategic reversal – that’s what may happen in 2021 if bulls keep pressing the EUR against the USD. Fundamentally, there needs to be a persistent weakness of the USD to allow that. Are there factors for the USD’s weakness? There are. The US Fed keeping the interest rates low and possibly maintaining quantitative easing line to keep the US economy marching, the general setting of the American global economic presence gradually giving room to the alternative global powers, and other tectonic movements. Will they be enough to push EUR/USD to 1.24? Very possibly.
EUR/GBP: symmetrical upside
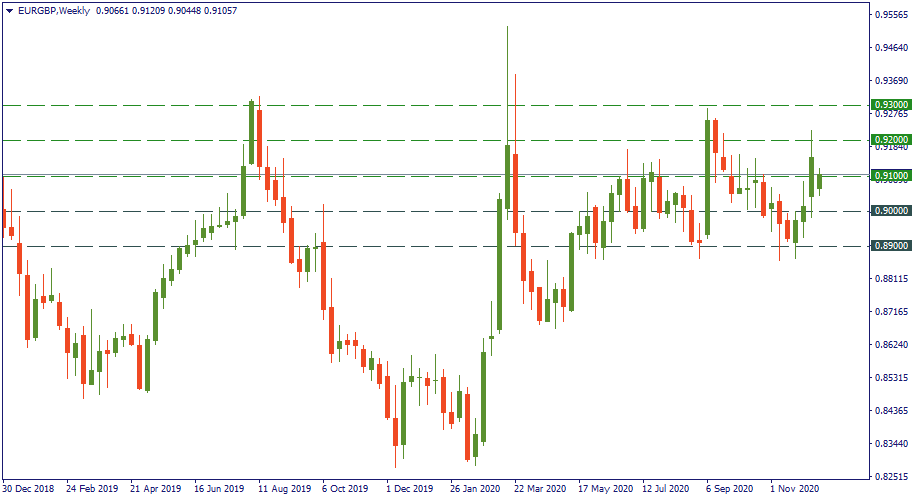
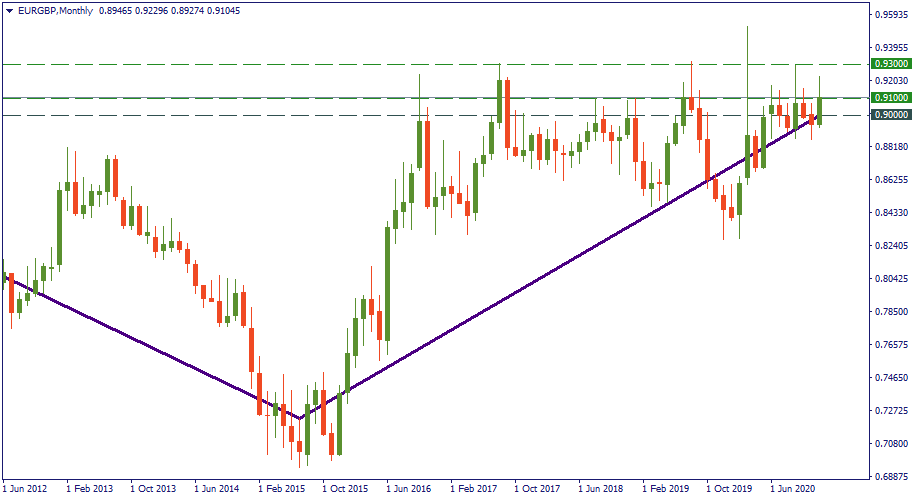
This currency pair has spent most of the year 2020 oscillating between 0.89 and 0.91. There were a couple of spikes up to 0.93 but that was more of an exception – and every such spike was followed by a correction down to the same 0.89.
On a monthly chart, coming to the heights of 0.90 roughly completes the five-year-long recovery of EUR/GBP symmetrical to the descent to 0.70 it did during the years 2010-2015. If that assessment is correct, going to 0.93 and above is very likely for this pair in the coming year. Fundamentally, there may be ground for that: the British pound has hardly more factors on its side against those on the euros. The first quarter of 2021 will bring more clarity on that.
USD/JPY: testing the support
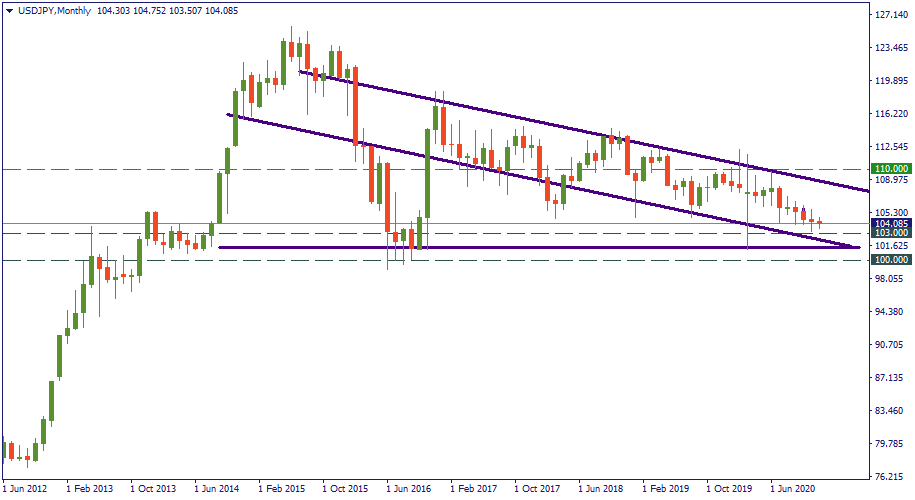
After a shockwave in January-February 2020, USD/JPY went into a downward trajectory that stretches from 110.00 to 103.00. Visibly, there is little technical evidence to suggest that this trend would see much change in the future.
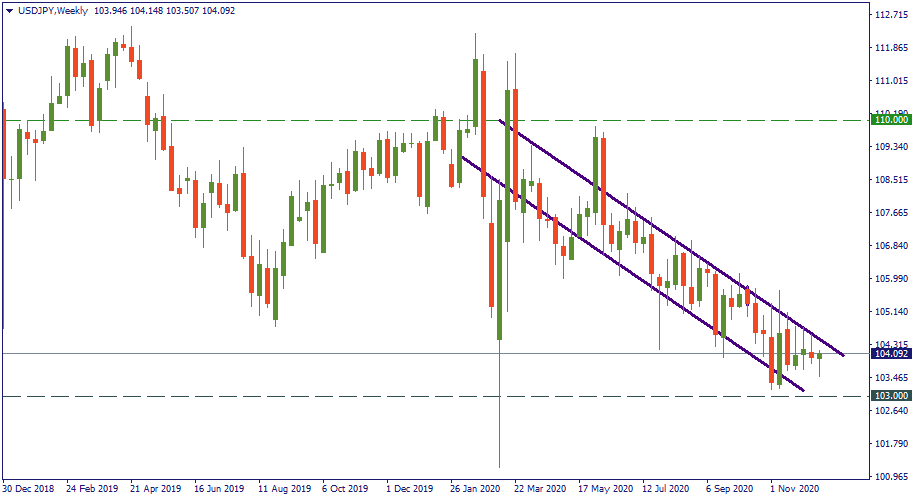
From a strategic point of view, coming down from 110.00 to 100.00 is an organic continuation of the large downslope that started above 120.00 in 2015. In the meantime, the area around 100.00 has been providing support to the currency pair movement since before 2015 and after that year. Currently, USD/JPY is exactly at this support so beware: technically, a bounce upwards is very possible in the coming year.
